
Drawing Utility
อินดิเคเตอร์
208 ดาวน์โหลด
เวอร์ชัน 1.0, Jul 2025
Windows, Mac
คำอธิบาย
กด Alt + ลากเพื่อเปิดใช้งานบนแผนภูมิของคุณ
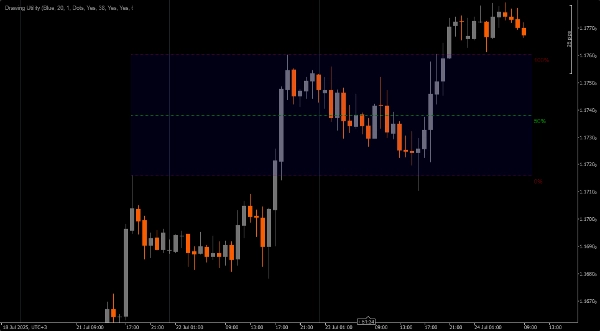
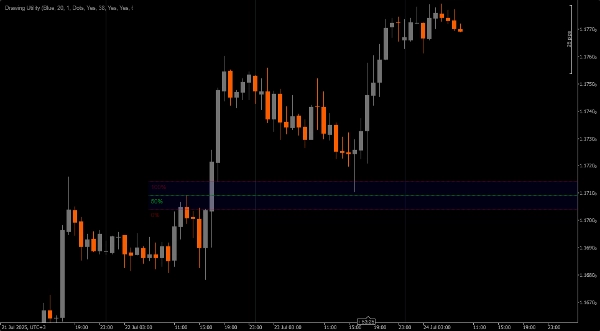
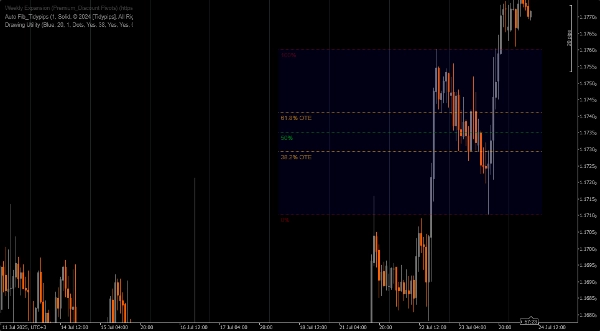
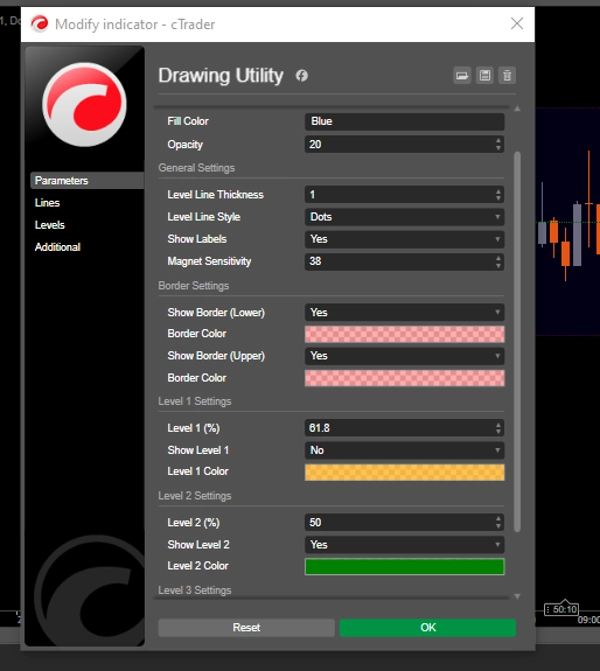
เครื่องมือวาดภาพที่ปรับแต่งได้
1. การเข้าถึง Fibonacci อย่างรวดเร็ว
2. ตัวทำเครื่องหมายช่องว่างมูลค่ายุติธรรม
3. เครื่องมือวัด
4. ตัวทำเครื่องหมายจุดที่น่าสนใจ
5. หรือการใช้งานอื่นใด (ซึ่งฉันยังไม่ได้นึกถึง) ที่คุณอาจเห็นว่าเหมาะสมสำหรับการบันทึกบนแผนภูมิของคุณ
หมายเหตุ **กด Alt + ลากเพื่อเปิดใช้งานบนแผนภูมิของคุณ**
สรุป
สรุปโดย AI
Drawing Utility is a customizable chart annotation tool designed for trading platforms. It features a rectangular box with five adjustable Fibonacci levels, which can also be customized to user-defined values. The utility is activated by pressing Alt and dragging on the chart. Key functionalities include quick access to Fibonacci retracement levels, marking Fair Value Gaps, measuring price movements, and highlighting Points of Interest. Additionally, it supports flexible use cases for various chart annotations, allowing traders to tailor it to their specific analysis needs.
โปรไฟล์อินดิเคเตอร์
รีวิวจากลูกค้า
0.0
รีวิว: 0
รีวิวจากลูกค้า
ยังไม่มีรีวิวสำหรับผลิตภัณฑ์นี้ หากเคยลองแล้ว ขอเชิญมาเป็นคนแรกที่บอกคนอื่น!
การสนทนา
คำถามที่พบบ่อย
ผลิตภัณฑ์ที่มีให้บริการผ่าน cTrader Store รวมถึงบอทการเทรด อินดิเคเตอร์ และปลั๊กอิน มีให้บริการโดยนักพัฒนาบุคคลที่สามและมีไว้เพื่อวัตถุประสงค์ในการเข้าถึงข้อมูลและทางเทคนิคเท่านั้น cTrader Store ไม่ใช่โบรกเกอร์และไม่ได้ให้คำแนะนำการลงทุน คำแนะนำส่วนบุคคล หรือการรับประกันผลการดำเนินงานในอนาคต
เพิ่มเติมจากผู้เขียนคนนี้


ราคา
15
การขาย
4.63K
ติดตั้งฟรี