
คำอธิบาย
ตัวบ่งชี้เวลาถึงจุดคุ้มทุน LITE
เวอร์ชัน Lite
นี่คือเวอร์ชันทดลองใช้งานฟรีของตัวบ่งชี้เวลาถึงจุดคุ้มทุน จำกัดเฉพาะ EURGBP และจะทำงานได้เพียง 2 นาทีเท่านั้น
ตัวบ่งชี้เวลาถึงจุดคุ้มทุน
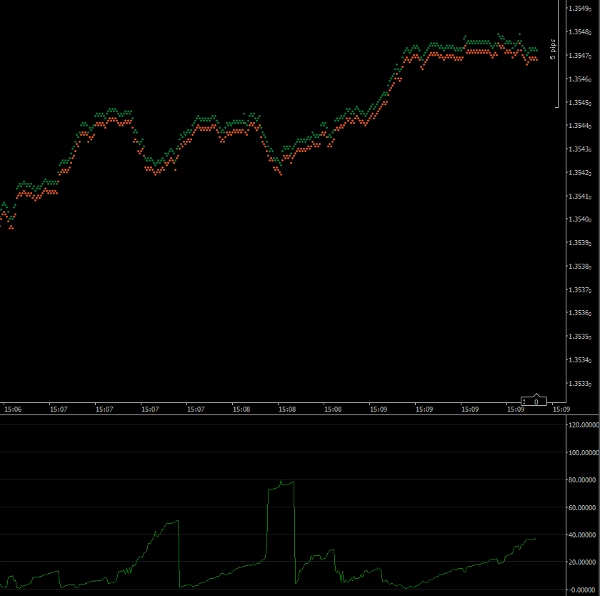
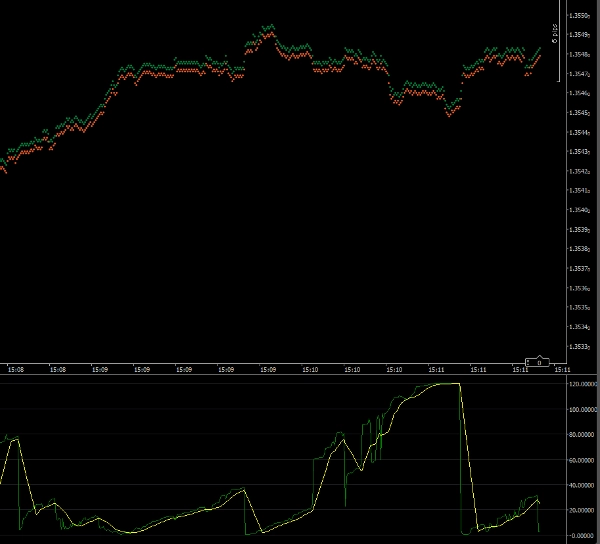
ตัวบ่งชี้นี้จะช่วยคุณกำหนดเวลาที่จะเข้าซื้อขายในตลาด กราฟจะแสดงจำนวนวินาทีที่คาดว่าจะใช้ในการทำให้การเทรดของคุณถึงจุดคุ้มทุน หากตลาดเคลื่อนไหวเร็วและไปในทิศทางของคุณ ตัวบ่งชี้จะแสดงตัวเลขที่น้อย หากตลาดเคลื่อนไหวสวนทางหรือช้า ตัวเลขจะมากขึ้น
ตัวบ่งชี้จะคำนวณจำนวนพิปส์ที่การเทรดของคุณต้องการเพื่อถึงจุดคุ้มทุน จากนั้นจะเปรียบเทียบกับความเร็วปัจจุบันที่ราคากำลังเคลื่อนไหว
หมายเหตุ ตัวบ่งชี้นี้ควรใช้งานบนกรอบเวลาหนึ่ง Tick
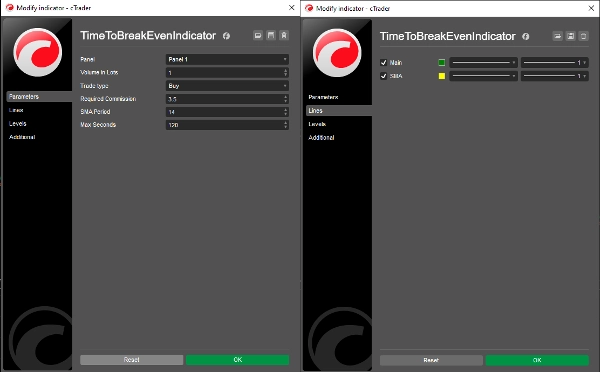
พารามิเตอร์
ปริมาณในล็อต: ปริมาณการเทรดที่คุณต้องการ
ประเภทการเทรด: การเทรดของคุณเป็นการซื้อหรือขาย
ค่าคอมมิชชั่นที่ต้องการ: ค่าคอมมิชชั่นที่การเทรดของคุณจะเกิดขึ้น (คุณสามารถดูได้จากหน้าต่าง Quick Trade)
ช่วง SMA: ช่วงของกราฟค่าเฉลี่ยเคลื่อนที่แบบง่าย (ค่าเริ่มต้น = 14)
วินาทีสูงสุด: จำนวนวินาทีสูงสุดที่จะถูกบันทึก (ดูด้านล่าง)
เส้น
หลัก: เส้นกราฟตัวบ่งชี้ (ค่าเริ่มต้น = สีเขียว)
SMA: เส้นกราฟค่าเฉลี่ยเคลื่อนที่แบบง่าย (ค่าเริ่มต้น = สีเหลือง)
วินาทีสูงสุด
การอนุญาตให้ตัวบ่งชี้แสดงค่าที่ใหญ่มากจะทำให้สเกลของตัวบ่งชี้ป้องกันไม่ให้คุณเห็นรายละเอียดเมื่อเวลาถึงจุดคุ้มทุนสั้น การตั้งค่านี้ช่วยให้คุณกำหนดสเกลสูงสุดของตัวบ่งชี้ โดยค่าเริ่มต้นตั้งไว้ที่ 120 (2 นาที) ดังนั้นผลลัพธ์ใดๆ ที่เป็น 2 นาทีขึ้นไปจะถูกแสดงเป็น 120 วินาที
ดร. แอนดี้ ลาร์กิน
ลิขสิทธิ์ 2025 สงวนลิขสิทธิ์ทั้งหมด
26 พฤษภาคม 2025
ข้อกฎหมาย
ผลลัพธ์จากตัวบ่งชี้นี้ควรตรวจสอบความถูกต้องก่อนนำไปใช้ในการเทรดจริง
ไม่มีการรับประกันหรือบ่งชี้ใดๆ สำหรับผลลัพธ์ของตัวบ่งชี้นี้
ไม่รับผิดชอบต่อความสูญเสียใดๆ ที่เกิดขึ้นจากการใช้ตัวบ่งชี้นี้


!["[CB] Pivot Points Pro" โลโก้](https://cdn.ctrader.com/image/webp/43463c82-67b0-4f10-a4ba-901bba091d81_32594)


