
คำอธิบาย
ตัวบ่งชี้เวลาถึงจุดคุ้มทุน v2
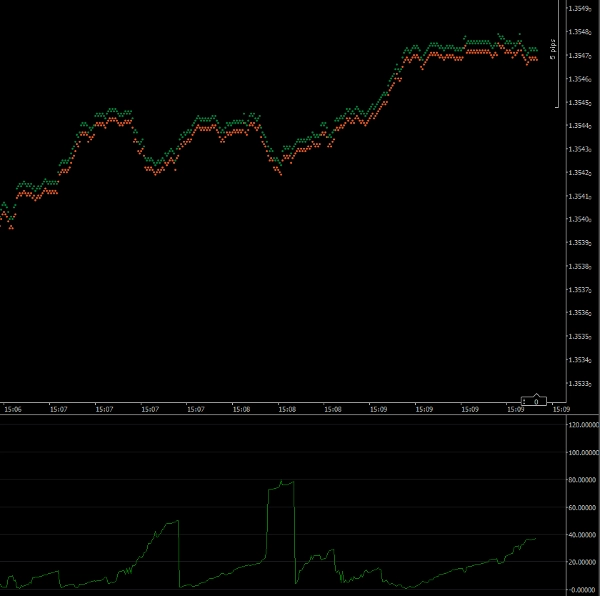
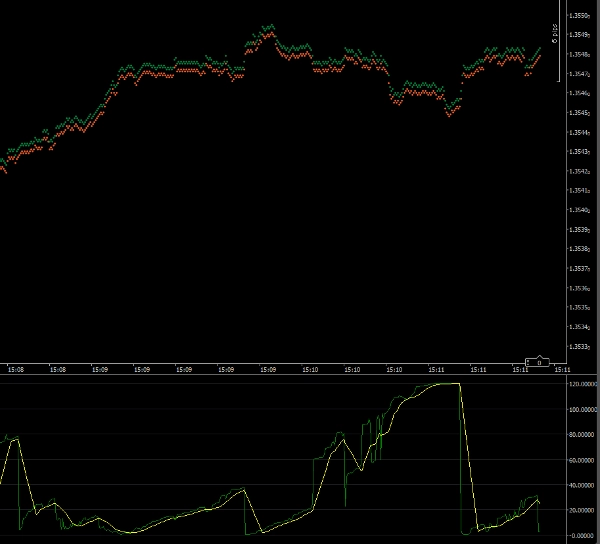
ตัวบ่งชี้นี้จะช่วยคุณกำหนดเวลาที่จะเข้าซื้อขายในตลาด กราฟจะแสดงจำนวนวินาทีที่เป็นไปได้สำหรับการซื้อขายของคุณที่จะถึงจุดคุ้มทุน หากตลาดเคลื่อนไหวเร็วและไปในทิศทางของคุณ ตัวบ่งชี้จะแสดงตัวเลขที่น้อย หากตลาดเคลื่อนไหวสวนทางหรือช้า ตัวเลขจะมากขึ้น
ตัวบ่งชี้จะคำนวณจำนวนพิปส์ที่การซื้อขายของคุณต้องการเพื่อถึงจุดคุ้มทุน จากนั้นจะเปรียบเทียบกับความเร็วปัจจุบันที่ราคากำลังเคลื่อนไหว
หมายเหตุ ตัวบ่งชี้นี้ควรใช้งานบนกรอบเวลาหนึ่งทิก
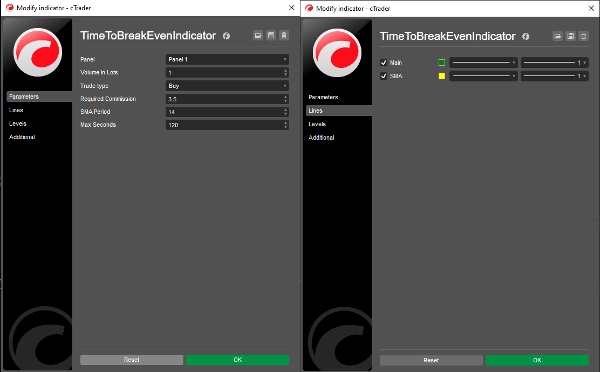
พารามิเตอร์
ปริมาณในล็อต: ปริมาณการซื้อขายที่คุณวางแผนไว้
ประเภทการซื้อขาย: ว่าการซื้อขายของคุณเป็นการซื้อหรือขาย
ค่าคอมมิชชั่นที่ต้องการ: ค่าคอมมิชชั่นที่การซื้อขายของคุณจะเกิดขึ้น (คุณสามารถดูได้จากหน้าต่าง Quick Trade)
ช่วง SMA: ช่วงของกราฟค่าเฉลี่ยเคลื่อนที่แบบง่าย (ค่าเริ่มต้น = 14)
วินาทีสูงสุด: จำนวนวินาทีสูงสุดที่จะถูกบันทึก (ดูด้านล่าง)
เส้น
หลัก: เส้นกราฟตัวบ่งชี้ (ค่าเริ่มต้น = สีเขียว)
SMA: เส้นกราฟค่าเฉลี่ยเคลื่อนที่แบบง่าย (ค่าเริ่มต้น = สีเหลือง)
วินาทีสูงสุด
การอนุญาตให้ตัวบ่งชี้แสดงค่าที่ใหญ่มากจะทำให้สเกลของตัวบ่งชี้ป้องกันไม่ให้คุณเห็นรายละเอียดเมื่อเวลาถึงจุดคุ้มทุนสั้น การตั้งค่านี้ช่วยให้คุณกำหนดสเกลสูงสุดของตัวบ่งชี้ ค่าเริ่มต้นตั้งไว้ที่ 120 (2 นาที) ดังนั้นผลลัพธ์ใดๆ ที่เป็น 2 นาทีขึ้นไปจะถูกแสดงเป็น 120 วินาที
ดร. แอนดี้ ลาร์กิน
ลิขสิทธิ์ 2025 สงวนลิขสิทธิ์ทั้งหมด
26 พฤษภาคม 2025
ข้อกฎหมาย
ผลลัพธ์จากตัวบ่งชี้นี้ควรตรวจสอบความถูกต้องก่อนใช้งานในการซื้อขายจริง
ไม่มีการรับประกันหรือการบ่งชี้ใดๆ สำหรับผลลัพธ์ของตัวบ่งชี้นี้
ไม่รับผิดชอบต่อความสูญเสียใดๆ ที่เกิดขึ้นจากการใช้ตัวบ่งชี้นี้
สรุป
รีวิวจากลูกค้า
5 | 50 % | |
4 | 50 % | |
3 | 0 % | |
2 | 0 % | |
1 | 0 % |


