Penerangan
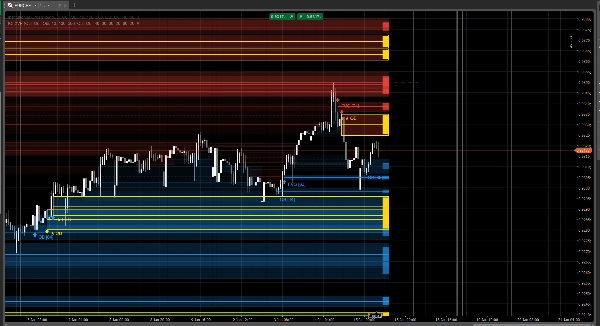
IOF Fusion Zones adalah lapisan struktur pasaran premium yang menunjukkan konsep Aliran Pesanan Institusi (FVG + Blok Pesanan + Kecairan) dengan visualisasi zon gaya “profil volum mikro”.
Daripada melukis segi empat tepat generik, setiap zon dinilai, dibobotkan, dan dipaparkan dengan garis pusat gaya POC dan bar intensiti, membantu anda segera mencari bunyi berkualiti rendah daripada kawasan berkeyakinan tinggi.
Alat ini direka untuk pedagang yang mahukan struktur bersih + penarafan zon objektif.
Apa yang dikesan
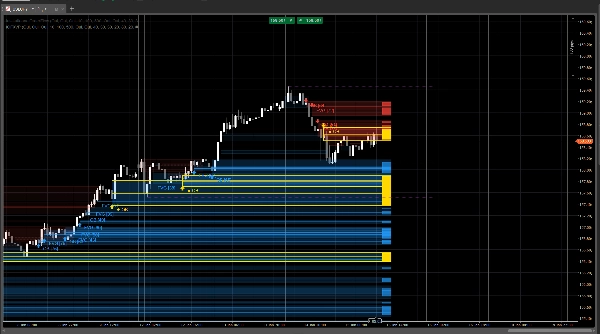
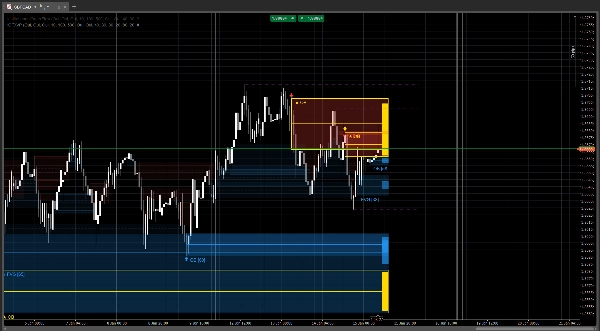
1) Zon IOF Pintar
- Jurang Nilai Adil (FVG) menggunakan logik jurang 3-bar yang ketat
- Blok Pesanan (OB) dikesan dari Pecahan Struktur (BOS) logik (lilin bertentangan terakhir sebelum peralihan)
- Zon melanjut ke hadapan dan kekal boleh digunakan sehingga pengurangan atau tamat tempoh
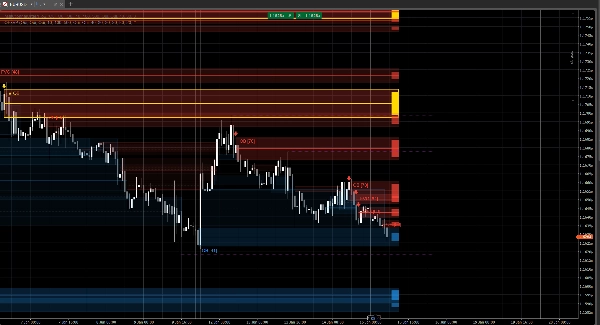
2) Tahap Kecairan
- Kolam kecairan berasaskan ayunan (tinggi/rendah) dilukis sebagai tahap bertitik
- Secara automatik mengesan sapu + tingkah laku penolakan (sapu + tutup kembali melalui tahap)
Enjin Penarafan Alpha (0–100)
Setiap zon menerima Skor Alpha berdasarkan 3 komponen berbobot (boleh dikonfigurasikan sepenuhnya):
- Z-Skor Volum (kekuatan volum relatif)
- Peralihan vs ATR (kekuatan pergerakan / kualiti impuls)
- Konfluens (kedekatan dengan zon aktif lain + tahap kecairan)
Anda boleh tetapkan:
- Skor minimum untuk dipaparkan
- Ambang ekstrem (zon ditandakan sebagai premium/utama)
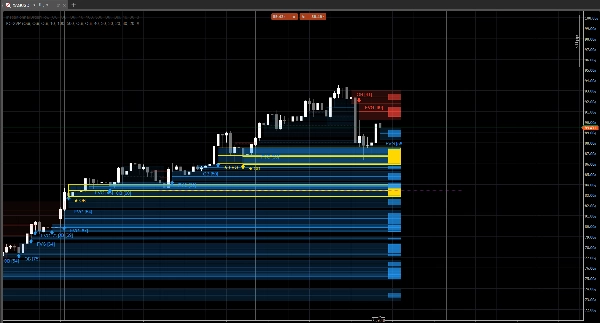
Visualisasi Mikro-Profil (POC + Intensiti)
Setiap zon sah boleh memaparkan:
- Garis POC (tengah zon) — bertindak sebagai “harga kawalan” yang jelas di dalam zon
- Bar intensiti (gaya profil volum) — ketinggian dan kecerahan mencerminkan Skor Alpha
- Pilihan label, anak panah, dan sempadan ekstrem untuk penapisan segera
Ini menjadikan zon mudah dibaca dengan sekilas pandang:
- pudar = kepentingan rendah
- isi kuat + POC tebal = zon berkualiti tinggi
- aksen emas = tahap ekstrem / keutamaan
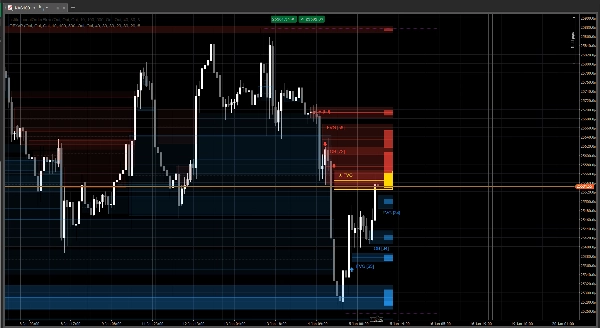
Logik Pengurangan & Ujian Semula
- Zon menjejaki ujian semula pertama dan boleh “meningkatkan” Skor Alpha mereka selepas sentuhan sah
- Zon yang dikurangkan boleh:
-
- disimpan pada carta (gaya pudar, coretan), atau
- dibuang sepenuhnya (mod bersih)
Imbasan Sejarah (konteks pantas)
Pada larian pertama, penunjuk boleh mengimbas sehingga 2,000 bar (ditetapkan pengguna) untuk membina konteks segera:
- zon FVG / OB lalu
- tahap kecairan
- pemeriksaan keadaan pengurangan
Amaran (pilihan)
Terima amaran untuk:
- Zon ekstrem
- Ujian semula pertama zon sah
(Amaran direka untuk mencetuskan hanya pada peristiwa bermakna bagi mengelakkan spam.)
Penggunaan Disyorkan
- Kenal pasti zon reaksi berkualiti tinggi (OB/FVG) yang dinilai oleh Skor Alpha
- Gunakan garis kecairan untuk menjangka tingkah laku sapu/penolakan
- Fokus pada Zon Ekstrem + Alpha Tinggi di mana struktur + peralihan + volum selari
- Gabungkan dengan model pelaksanaan dan peraturan risiko anda sendiri
Penafian
Penunjuk ini adalah alat sokongan keputusan, bukan nasihat kewangan. Keadaan pasaran berbeza mengikut simbol dan sesi. Sentiasa uji semula dan urus risiko dengan betul.