
คำอธิบาย
คุณสมบัติหลัก
- การหยุดแบบไดนามิกตาม ATR: ปรับระยะการหยุดตามความผันผวนของตลาดในปัจจุบันโดยอัตโนมัติ - กว้างขึ้นในสภาวะผันผวน, แคบลงในตลาดที่สงบ
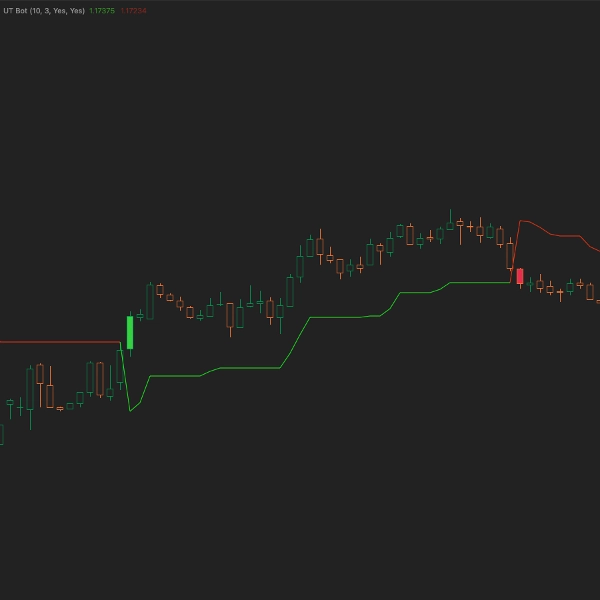
- สัญญาณภาพที่ชัดเจน: แถบสีมะนาวสำหรับแนวโน้มขาขึ้น, แถบสีแดงเข้มสำหรับแนวโน้มขาลง - มองเห็นทิศทางแนวโน้มได้ทันทีโดยไม่ทำให้กราฟของคุณรก
- การแจ้งเตือนที่เลือกได้: เปิดใช้งานการแจ้งเตือนป๊อปอัพและเสียงเพื่อรับทราบการเปลี่ยนแปลงแนวโน้มแม้เมื่อไม่ได้อยู่หน้าจอ
- การระบายสีแท่งตามสัญญาณ: แท่งจะเปลี่ยนสีทันทีเมื่อแนวโน้มกลับตัว เพื่อยืนยันด้วยภาพเมื่อราคาข้ามระดับการหยุดตามหลัง
วิธีการทำงาน
UT Bot คำนวณการหยุดตามหลังโดยอิงจากช่วง ATR คูณด้วยการตั้งค่าความไวของคุณ เมื่อราคาสูงกว่าการหยุด แนวโน้มจะเป็นขาขึ้น เมื่อราคาข้ามลงต่ำกว่า แนวโน้มจะกลับเป็นขาลง ตัวบ่งชี้ติดตามการเปลี่ยนแปลงเหล่านี้และระบายสีแท่งเพื่อสัญญาณการเข้าออกที่เป็นไปได้
การหยุดตามหลังจะเคลื่อนที่เฉพาะในทิศทางของแนวโน้ม - จะเพิ่มขึ้นในช่วงแนวโน้มขาขึ้นและลดลงในช่วงแนวโน้มขาลง เพื่อรักษากำไรในขณะที่ให้พื้นที่สำหรับการเทรด
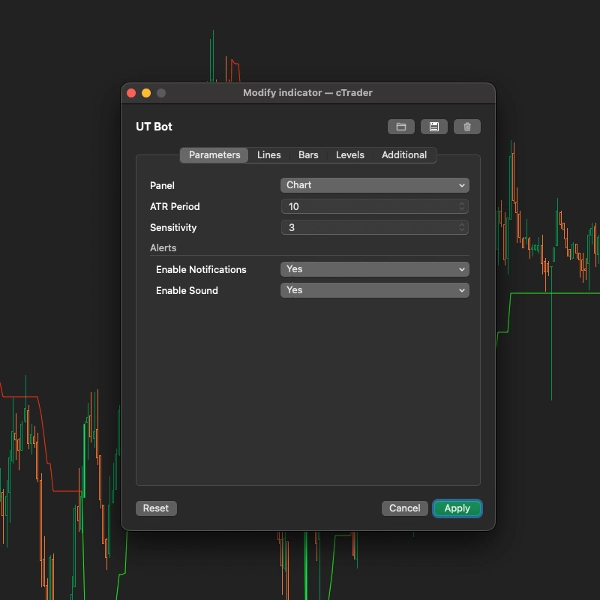
พารามิเตอร์
การตั้งค่าหลัก
- ช่วง ATR (ค่าเริ่มต้น: 10): จำนวนแท่งที่ใช้คำนวณช่วงจริงเฉลี่ย ค่าสูง = สัญญาณที่นุ่มนวลแต่ช้าลง
- ความไว (ค่าเริ่มต้น: 3.0): ตัวคูณสำหรับระยะ ATR ค่าสูงสร้างการหยุดตามหลังที่กว้างขึ้น (สัญญาณเท็จน้อยลง, เข้าช้ากว่า) ค่าต่ำสร้างการหยุดที่แคบลง (สัญญาณมากขึ้น, การกลับตัวเท็จมากขึ้น)
การตั้งค่าการแจ้งเตือน
- เปิดใช้งานการแจ้งเตือน (ค่าเริ่มต้น: ปิด): แสดงการแจ้งเตือนป๊อปอัพเมื่อแนวโน้มเปลี่ยนแปลง
- เปิดใช้งานเสียง (ค่าเริ่มต้น: ปิด): เล่นเสียงเมื่อแนวโน้มเปลี่ยน (เสียงบวกสำหรับขาขึ้น, เสียงลบสำหรับขาลง)
เหมาะสำหรับ
- เทรดเดอร์แนวโน้มที่ต้องการการวางจุดหยุดขาดทุนแบบไดนามิก
- เทรดเดอร์ที่ต้องการเห็นทิศทางแนวโน้มอย่างชัดเจน
- ผู้ที่มองหาระบบติดตามแนวโน้มแบบกลไก
- ตั้งแต่สแคปเปอร์จนถึงเทรดเดอร์สวิง (ปรับความไวตามความเหมาะสม)
เคล็ดลับ
- สแคปปิ้ง: ใช้ช่วง ATR 5-7, ความไว 1.5-2.0 เพื่อสัญญาณที่รวดเร็วขึ้น
- สวิงเทรดดิ้ง: ใช้ช่วง ATR 10-14, ความไว 3.0-4.0 เพื่อลดสัญญาณเท็จ
- การยืนยัน: รวมกับปริมาณหรืออินดิเคเตอร์อื่นๆ เพื่อการเข้าเทรดที่มีความน่าจะเป็นสูงขึ้น
สรุป
Key functionalities include detecting bullish and bearish momentum shifts when price crosses the trailing stop, visually signaling these reversals by coloring bars green for bullish flips and red for bearish flips, and drawing adaptive trailing stop bands above or below price. The indicator is non-repainting and overlays directly on the chart for immediate insight.
Users can customize core parameters such as ATR period (default 10) and sensitivity (default 3), and enable optional popup and sound alerts for trend changes. UT Bot is suitable for various markets including Forex, indices, and cryptocurrencies like BTCUSD and XAUUSD. It is recommended to use UT Bot alongside trend filters or volume indicators to enhance confirmation in trending or breakout environments.
รีวิวจากลูกค้า
5 | 67 % | |
4 | 33 % | |
3 | 0 % | |
2 | 0 % | |
1 | 0 % |


