
Açıklama
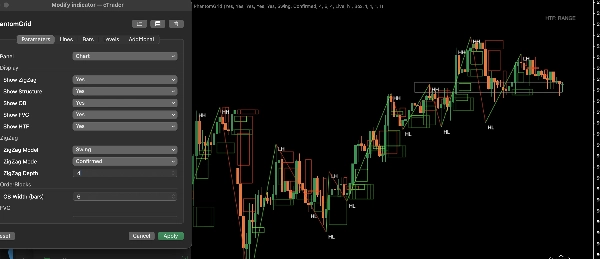
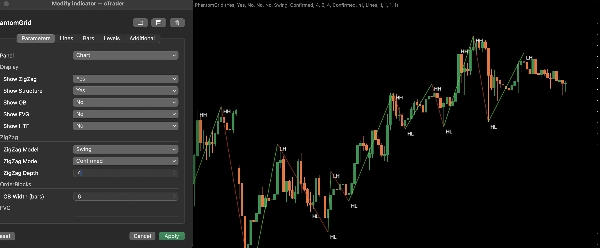
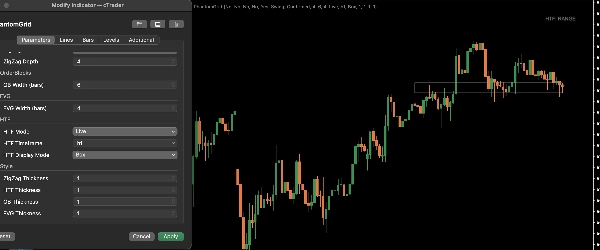
PhantomGrid, fiyat hareketi analizine açıklık, yapı ve hassasiyet getirmek için tasarlanmış profesyonel düzeyde bir ızgara görselleştirme göstergesidir.
Herhangi bir sembol ve zaman diliminde dinamik ızgara seviyelerini otomatik olarak çizer, traderların tepki bölgelerini belirlemesine, giriş ve çıkışları iyileştirmesine ve işlemleri daha tutarlı planlamasına yardımcı olur.
PhantomGrid, gereksiz grafik karmaşası olmadan temiz, yapılandırılmış bir çerçeve isteyen hem takdirli hem de sistematik traderlar için tasarlanmıştır. Gösterge, farklı ortamlar arasında görsel netlik ve doğruluğu korurken piyasa koşullarındaki değişikliklere sorunsuzca uyum sağlar.
Ana Özellikler
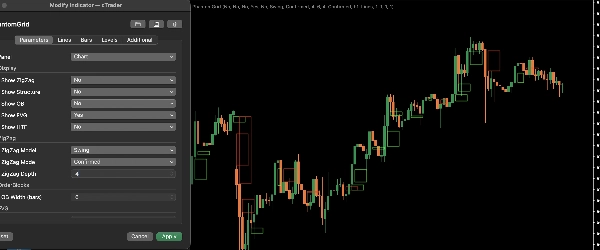
• Tüm semboller ve zaman dilimleri için otomatik dinamik ızgara çizimi
• Tepki bölgeleri, likidite alanları ve yapılandırılmış düzenleri belirlemeye yardımcı olur
• Dikkat dağıtmayan analiz için temiz, minimal görsel tasarım
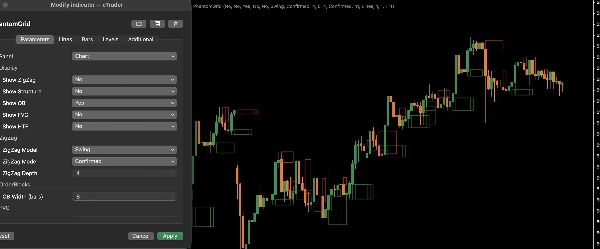
• Tamamen özelleştirilebilir ızgara aralığı, stil ve davranış
• Hafif ve sorunsuz performans için optimize edilmiş
• Scalping, günlük ve swing trading iş akışları için uygundur
Traderlar PhantomGrid'i Nasıl Kullanır
PhantomGrid, traderlara yardımcı olur:
• piyasa hareketini daha net yapılandırmak
• yüksek olasılıklı tepki alanlarını belirlemek
• giriş ve çıkış zamanlamasını iyileştirmek
• işlemleri daha sistematik yönetmek
• enstrümanlar arasında tutarlılığı korumak
Bağımsız bir araç olarak veya mevcut stratejiler ve iş akışlarıyla birlikte etkili bir şekilde çalışır.
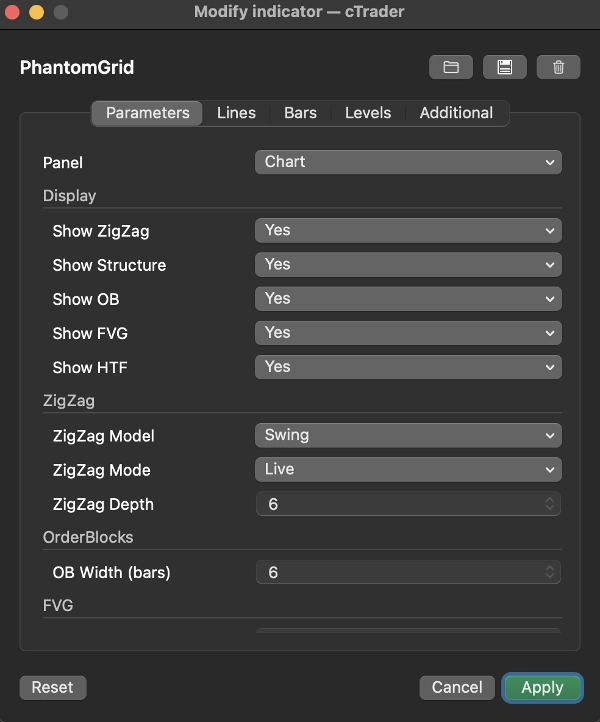
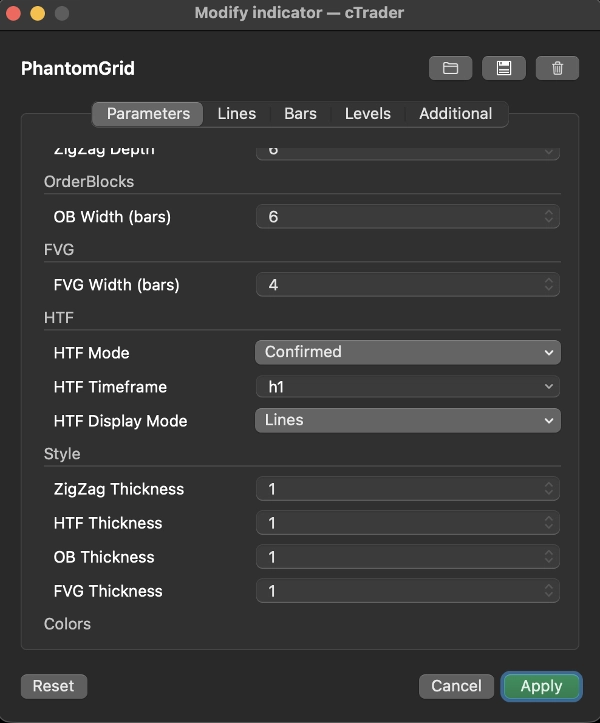
Özelleştirme Seçenekleri
PhantomGrid, farklı ticaret stillerine uyacak esnek ayarlar içerir:
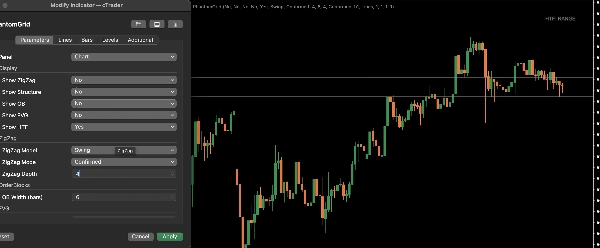
• ızgara aralığı kontrolleri
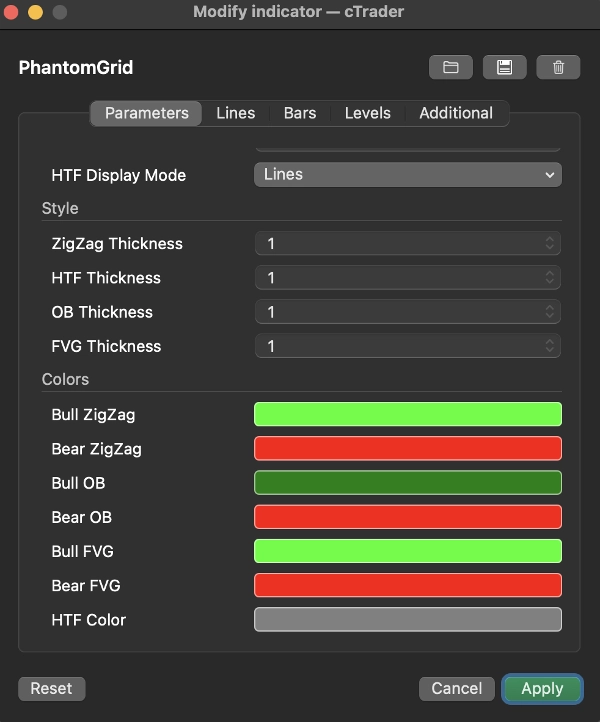
• görsel stil ve renk ayarları
• daha temiz düzenler için görünürlük ayarları
• farklı volatilite koşulları için davranış ayarı
Bu seçenekler, traderların göstergeleri tam iş akışlarına ve tercihlerine göre uyarlamalarına olanak tanır.
Performans ve Uyumluluk
PhantomGrid, stabil ve verimli performans için tasarlanmıştır ve desteklenen tüm semboller ve zaman dilimleri üzerinde cTrader içinde sorunsuz çalışır. Gösterge, profesyonel grafik düzenlerine doğal olarak entegre olur ve platform performansını yavaşlatmaz.
Tam 7 günlük deneme sürümü dahildir. Kısıtlama yoktur.
Geçmiş performans gelecekteki sonuçları garanti etmez. Bu gösterge yalnızca bilgilendirme amaçlıdır ve finansal tavsiye niteliği taşımaz.
Özet
Müşteri değerlendirmeleri
5 | 100 % | |
4 | 0 % | |
3 | 0 % | |
2 | 0 % | |
1 | 0 % |


!["[Stellar Strategies] Smart ADX" logosu](https://cdn.ctrader.com/image/webp/af13b084-b6f6-41db-b7bc-c7e688b57b05_36929)


