
Descrizione
Conosci esattamente quando i principali mercati aprono e chiudono. FX Market Sessions mostra le quattro sessioni di trading chiave con i loro livelli massimi e minimi, aiutandoti a temporizzare le tue entrate nelle ore più volatili della giornata.
Caratteristiche principali
- Quattro sessioni principali: sessioni di Sydney, Tokyo, Londra e New York visualizzate con orari di inizio/fine personalizzabili e regolazione automatica dell’ora legale
- Livelli massimi/minimi della sessione: traccia e mostra automaticamente il massimo e il minimo di ogni sessione con linee estendibili per la pianificazione di supporti/resistenze
- Visualizzazione sessione in tempo reale: il pannello informativo in tempo reale mostra quali sessioni sono attualmente aperte - niente più indovinelli su quando iniziano Londra o New York
- Contesto storico: visualizza fino a 10 giorni di livelli delle sessioni passate per vedere come il prezzo ha reagito ai confini chiave delle sessioni
- Personalizzazione completa: scegli quali sessioni visualizzare, seleziona colori personalizzati e decidi se estendere i livelli massimi/minimi all’infinito
Come funziona
L’indicatore calcola automaticamente le quattro principali sessioni di trading forex basandosi sui rispettivi fusi orari locali:
- Sydney: 21:00-06:00 AEST (si adatta all’ora legale)
- Tokyo: 00:00-09:00 JST
- Londra: 08:00-17:00 GMT (si adatta all’ora legale)
- New York: 13:00-22:00 EST (si adatta all’ora legale)
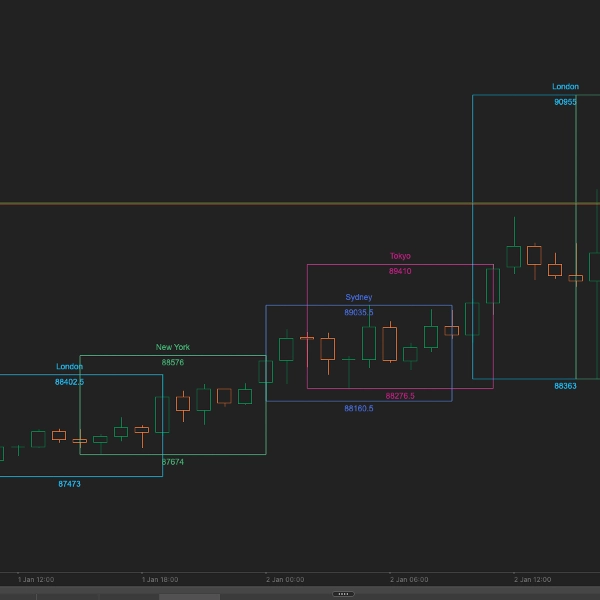
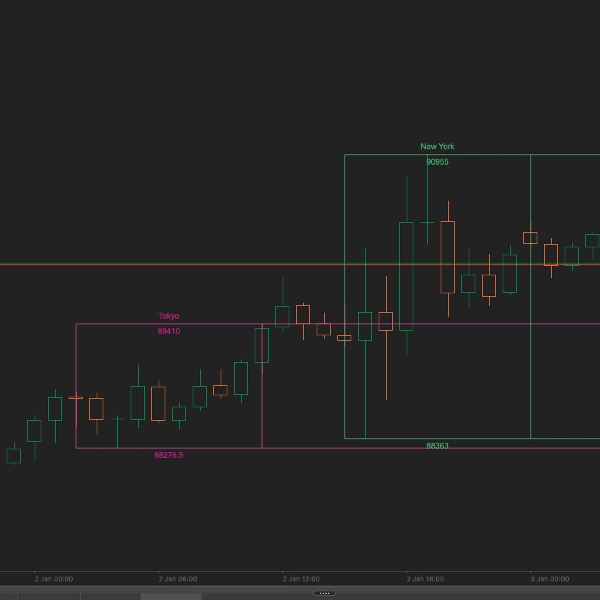
Ogni sessione è disegnata come una zona verticale con i suoi livelli massimo e minimo segnati. Il pannello informativo nell’angolo in alto a destra mostra in tempo reale quali sessioni sono attualmente aperte.
Parametri
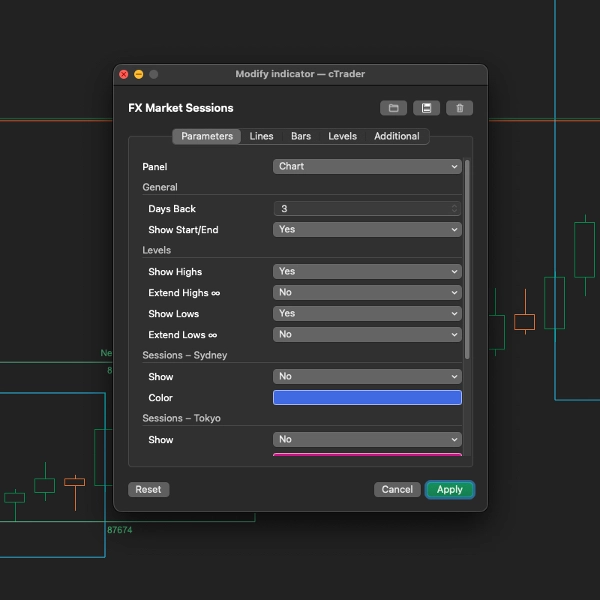
Impostazioni generali
- Giorni indietro (Predefinito: 3): Numero di giorni storici per visualizzare le caselle delle sessioni (0-10)
- Mostra inizio/fine (Predefinito: True): Disegna linee verticali agli orari di apertura e chiusura della sessione
Impostazioni livelli
- Mostra massimi (Predefinito: True): Visualizza il livello massimo di ogni sessione
- Estendi massimi (Predefinito: False): Estendi le linee dei massimi fino al bordo destro del grafico
- Mostra minimi (Predefinito: True): Visualizza il livello minimo di ogni sessione
- Estendi minimi (Predefinito: False): Estendi le linee dei minimi fino al bordo destro del grafico
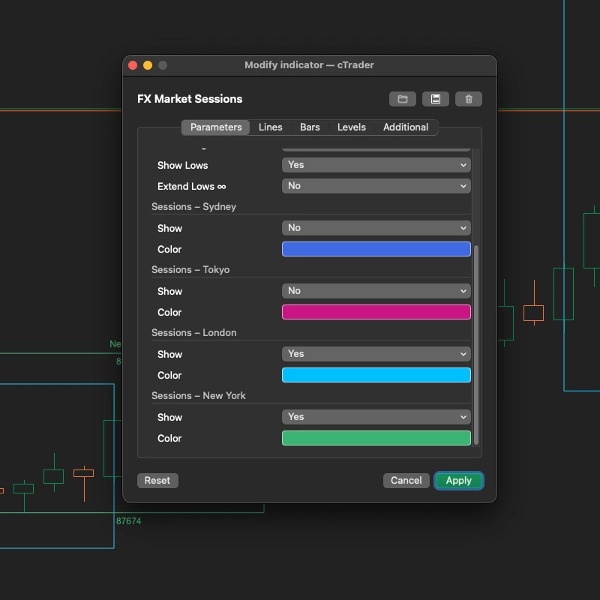
Impostazioni sessione (Sydney, Tokyo, Londra, New York)
- Mostra: Abilita o disabilita singole sessioni
- Colore: Colore personalizzato per gli elementi di visualizzazione di ogni sessione
Ideale per
- Trader giornalieri che devono sapere quando aumenta la volatilità
- Trader breakout che operano all’apertura delle sessioni
- Trader che utilizzano i livelli massimi/minimi delle sessioni come supporto/resistenza
- Chiunque voglia visualizzare le migliori ore di trading
Consigli di trading
- Apertura di Londra: uno dei periodi più volatili - spesso determina la direzione della giornata
- Sovrapposizione Londra/New York: dalle 13:00 alle 16:00 GMT solitamente si registra il volume e la volatilità più alti
- Sessione asiatica: la migliore per il trading di coppie JPY e AUD
- Rotture di sessione: il prezzo che supera il massimo/minimo di una sessione può segnalare movimenti di continuazione
Timeframe supportati
Funziona in modo ottimale su timeframe da M5 a H4. L’indicatore adatta automaticamente le caselle delle sessioni per adattarsi alla scala del tuo grafico.
Riepilogo
Key features include automatic plotting of session high and low price levels, with options to extend these levels across the chart for support and resistance analysis. A live info panel shows which sessions are currently open in real-time. Users can customize which sessions to display, adjust colors, and set how many past days (up to 10) of session data to show, excluding weekends.
The indicator is optimized for intraday timeframes, working best on 5-minute to 4-hour charts. It provides historical context by showing previous session levels, aiding traders in timing entries around periods of increased volatility such as the London open and the London/New York overlap. This tool supports trading strategies that rely on session timing and price levels for breakout and intraday trading decisions.
Recensioni dei clienti
5 | 100 % | |
4 | 0 % | |
3 | 0 % | |
2 | 0 % | |
1 | 0 % |


