
คำอธิบาย
VolumeProfileSuite เป็นตัวบ่งชี้ Volume Profile ขั้นสูงและยืดหยุ่นสำหรับ cTrader.
วัตถุประสงค์หลักของมันคือการวิเคราะห์การกระจายปริมาณ (เช่น ที่ กิจกรรมการซื้อขายเกิดขึ้น) ในระดับราคาต่างๆ เพื่อระบุพื้นที่ของ "มูลค่า" (ปริมาณสูง) และ "การปฏิเสธ" (ปริมาณต่ำ) ซึ่งช่วยให้คุณค้นหาระดับแนวรับและแนวต้านที่สำคัญที่สุดโดยอิงจากกิจกรรมตลาดจริง.
คุณสมบัติที่โดดเด่นคือมันรวม โหมดวิเคราะห์ที่ทรงพลังสองโหมด ไว้ในเครื่องมือเดียว ซึ่งสามารถเลือกได้ผ่านพารามิเตอร์ Profile Mode :
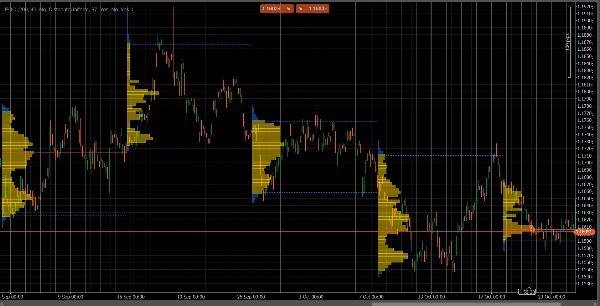
FixedRangeโหมด: เหมาะสำหรับการวิเคราะห์ ระดับมหภาค ช่วยให้คุณวิเคราะห์บล็อกขนาดใหญ่เพียงบล็อกเดียวที่คุณเลือก (เช่น 1000 แท่งล่าสุดหรือช่วงวันที่เฉพาะ เช่น "ทั้งสัปดาห์ที่ผ่านมา") เหมาะสำหรับการค้นหาระดับแนวรับ/แนวต้านหลักระยะยาว.Periodicโหมด: เหมาะสำหรับการวิเคราะห์ ระดับจุลภาค และพฤติกรรม มันจะวาดโปรไฟล์ใหม่โดยอัตโนมัติทุกๆ "N" แท่ง (เช่น ทุก 100 แท่ง) ช่วยให้คุณเห็นการเปลี่ยนแปลงของ POC และ Value Area ตามเวลาและศึกษารูปแบบซ้ำของตลาด.- คู่มือพารามิเตอร์ (ภาษาอังกฤษ)
นี่คือคู่มือที่อัปเดตสำหรับตัวบ่งชี้ VolumeProfileSuite แบบรวมใหม่ของคุณ คู่มือนี้สำคัญมากเพราะอธิบายว่าควรใช้พารามิเตอร์ใด (และควรละเว้นพารามิเตอร์ใด) ตามโหมดที่คุณเลือก.
กลุ่มที่ 1: โหมดหลัก
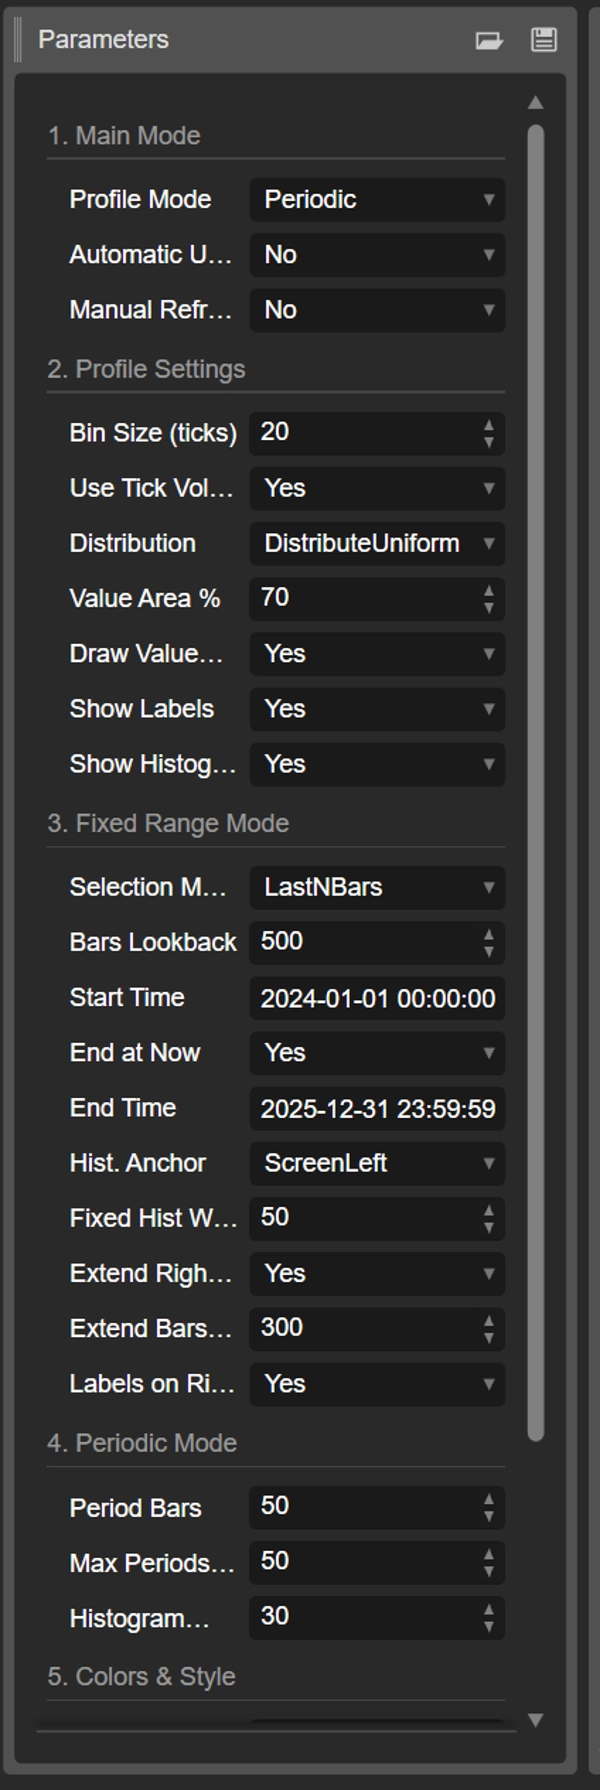
- Profile Mode: นี่คือพารามิเตอร์ที่ สำคัญที่สุด และทำหน้าที่เป็นสวิตช์หลัก.
-
FixedRange: เปิดใช้งานโหมด "บล็อกเดียว" ตัวบ่งชี้จะวิเคราะห์ เพียงช่วงเวลาเดียว ที่คุณกำหนด (โดยใช้การตั้งค่าในกลุ่มที่ 3).Periodic: เปิดใช้งานโหมด "วัฏจักร" ตัวบ่งชี้จะ วิเคราะห์โดยอัตโนมัติ ทั้งแผนภูมิเป็นบล็อก (ตามการตั้งค่าในกลุ่มที่ 4).
สำคัญ: เมื่ออยู่ในโหมด
FixedRangeคุณต้อง ละเว้น พารามิเตอร์ทั้งหมดใน "กลุ่มที่ 4: โหมด Periodic" เมื่ออยู่ในโหมดPeriodicคุณต้อง ละเว้น พารามิเตอร์ทั้งหมดใน "กลุ่มที่ 3: โหมด Fixed Range".
กลุ่มที่ 2: การตั้งค่าโปรไฟล์
พารามิเตอร์เหล่านี้เป็น ทั่วไป และใช้กับ ทั้งสอง โหมด (FixedRange และ Periodic).
- ขนาดบ็อกซ์ (ticks): ควบคุม "ความละเอียด" แนวตั้งของโปรไฟล์ ค่าเล็ก (เช่น
1) จะสร้างแถวราคาที่บางมาก (ละเอียดมาก) ค่าใหญ่ (เช่น10) จะจัดกลุ่มราคาเป็นแถวที่หนากว่า (ละเอียดน้อยลง, "เรียบกว่า"). - ใช้ Tick Volume: ถ้า
true(แนะนำ) โปรไฟล์จะใช้ปริมาณ tick จริง ซึ่งแม่นยำมาก ถ้าfalseมันจะนับ "1" สำหรับแต่ละแท่งเท่านั้น. - การกระจาย: กำหนดวิธีการกระจายปริมาณของแท่ง.
-
DistributeUniform(ค่าเริ่มต้น): "กระจาย" ปริมาณของแท่งไปทั่วระดับราคาทั้งหมดที่แท่งแตะถึง ตั้งแต่ต่ำสุดถึงสูงสุด.CloseOnly: กำหนดปริมาณทั้งหมดของแท่งให้กับราคาปิดเท่านั้น.
- เปอร์เซ็นต์พื้นที่มูลค่า: กำหนดเปอร์เซ็นต์ของปริมาณที่ประกอบเป็น "พื้นที่มูลค่า" (พื้นที่ที่มีกิจกรรมการซื้อขายสูงสุด) ค่า
70(70%) เป็นมาตรฐานตลาด. - วาดพื้นที่มูลค่า (VAH/VAL): ถ้า
trueจะวาดเส้นแนวนอนสำหรับ Value Area High (VAH) และ Value Area Low (VAL). - แสดงป้ายชื่อ: ถ้า
trueแสดงป้ายข้อความ ("POC", "VAH", "VAL") (ระวัง: ในโหมดPeriodicอาจทำให้แผนภูมิดูรก). - แสดงฮิสโตแกรม: ถ้า
trueวาดฮิสโตแกรมปริมาณ (แถวนอน).
กลุ่มที่ 3: โหมด Fixed Range
⚠️ ใช้พารามิเตอร์เหล่านี้เฉพาะเมื่อ "Profile Mode" ตั้งค่าเป็น FixedRange เท่านั้น.
- โหมดการเลือก: เลือก วิธี กำหนดบล็อกเดียวของคุณ.
-
DateRange: ใช้วันที่/เวลาที่เริ่มและสิ้นสุดเฉพาะ.LastNBars: ใช้แท่ง N แท่งล่าสุด.
- จำนวนแท่งย้อนหลัง: (สำหรับ
LastNBarsเท่านั้น) จำนวนแท่งย้อนหลังที่ต้องการวิเคราะห์ (เช่น500). - เวลาเริ่ม / สิ้นสุด ณ ปัจจุบัน / เวลา สิ้นสุด: (สำหรับ
DateRangeเท่านั้น) กำหนดจุดเริ่มต้นและสิ้นสุดของช่วงเวลาของคุณ. - จุดยึดฮิสโตแกรม: (สำหรับ
FixedRangeเท่านั้น) กำหนดตำแหน่งยึดฮิสโตแกรม. -
DateRangeStart: ที่จุดเริ่มต้นของช่วงเวลาของคุณ (อาจอยู่นอกหน้าจอ).ScreenLeft: ที่ขอบซ้ายของหน้าต่างที่มองเห็นได้.ScreenRight: ที่ขอบขวาของหน้าต่างที่มองเห็นได้ (ในพื้นที่ว่าง).
- ความกว้างฮิสโตแกรมคงที่ (แท่ง): ความกว้างของฮิสโตแกรม (เป็นแท่ง) สำหรับโหมด
FixedRange. - ขยายไปทางขวาเท่านั้น: ถ้า
trueเส้น POC/VAH/VAL จะถูกขยายไปในอนาคต. - ขยายแท่ง: (เฉพาะเมื่อ
Extend Right Onlyเป็นtrue) จำนวนแท่งที่ขยายเส้น. - ป้ายชื่อด้านขวา: ถ้า
trueวางป้ายราคาที่ปลายขวาของเส้นที่ขยาย.
กลุ่มที่ 4: โหมด Periodic
⚠️ ใช้พารามิเตอร์เหล่านี้เฉพาะเมื่อ "Profile Mode" ตั้งค่าเป็น Periodic เท่านั้น.
- จำนวนแท่งในช่วง: นี่คือพารามิเตอร์ สำคัญ สำหรับโหมดนี้ กำหนดจำนวนแท่งที่จะรวมใน แต่ละ บล็อกวัฏจักร (เช่น
100). - จำนวนช่วงสูงสุดที่วาด: 🌟 พารามิเตอร์ความปลอดภัย! จำกัดจำนวนโปรไฟล์วัฏจักรที่วาดเพื่อป้องกันไม่ให้ cTrader ค้าง
50หมายความว่าจะวาดโปรไฟล์ล่าสุดเพียง 50 โปรไฟล์เท่านั้น แม้ว่าประวัติจะมีมากกว่านั้น อย่าตั้งค่าสูงเกินไป (เช่น > 200) มิฉะนั้น cTrader อาจหยุดทำงาน! - ความกว้างฮิสโตแกรม (แท่ง): ความกว้างของฮิสโตแกรม (เป็นแท่ง) สำหรับ แต่ละ บล็อกวัฏจักร.
กลุ่มที่ 5: สีและสไตล์
พารามิเตอร์เหล่านี้เป็น ทั่วไป และใช้กับ ทั้งสอง โหมด.
- สี POC: สีของเส้น จุดควบคุม.
- สี VA: สีของเส้น VAH และ VAL.
- ความหนาของเส้น: ความหนาของเส้น POC, VAH และ VAL.
- สีฮิสโตแกรม VA: สีของแถบฮิสโตแกรม ภายใน พื้นที่มูลค่า (ค่าเริ่มต้น: สีเหลือง).
- สีฮิสโตแกรมภายนอก: สีของแถบฮิสโตแกรม นอก พื้นที่มูลค่า (ค่าเริ่มต้น: สีน้ำเงิน).
- ความทึบของฮิสโตแกรม %: ความโปร่งใส (ความทึบ) ของฮิสโตแกรมทั้งหมด.
สรุป
The indicator offers two main analysis modes selectable via the Profile Mode parameter:
1. FixedRange Mode: Analyzes a single user-defined interval, such as a specific date range or the last N bars, suitable for macro-level, long-term support and resistance identification.
2. Periodic Mode: Automatically segments the chart into consecutive blocks of N bars, drawing a new profile for each. This mode supports micro-level and behavioral analysis by tracking how the Point of Control (POC) and Value Area evolve over time.
Common configurable settings include bin size (price resolution), volume type (tick volume or bar count), volume distribution method, value area percentage, and visual options such as histogram display and labeling. FixedRange and Periodic modes have distinct parameter groups to tailor their respective analyses.
Color and style options allow customization of POC, Value Area lines, and histogram appearance. The tool supports various markets including Forex, indices, commodities, stocks, and cryptocurrencies, as indicated by its relevant tags.
รีวิวจากลูกค้า
5 | 50 % | |
4 | 50 % | |
3 | 0 % | |
2 | 0 % | |
1 | 0 % |


