
Descripción
Exhibición:
Indicador Supertrend – una herramienta esencial para los traders que facilita seguir las tendencias del mercado y tomar decisiones de inversión más inteligentes. Este indicador intuitivo y de nivel profesional está diseñado para ofrecer señales de compra y venta claras como el cristal, ya sea que estés comenzando o seas un inversor experimentado.
¿Por qué elegir el Indicador Supertrend?
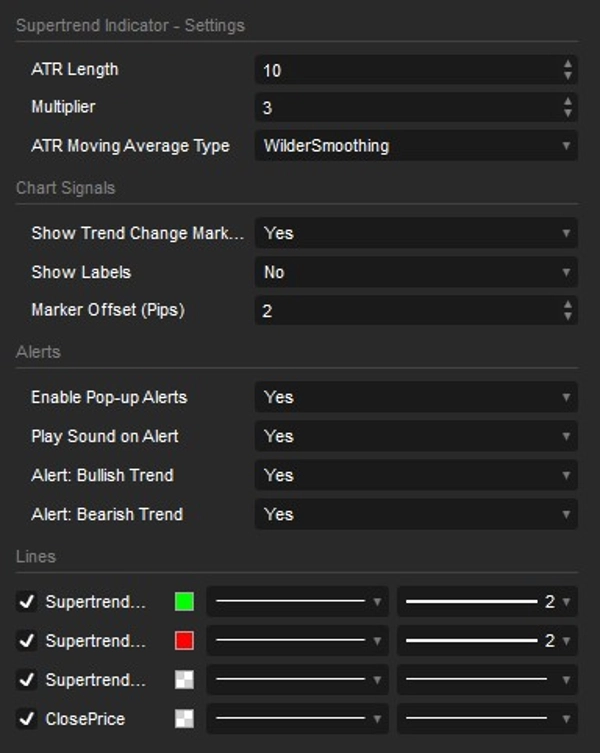
- Precisión Estándar de la Industria: Ahora con tipos personalizables de Media Móvil ATR (incluyendo el suavizado de Wilder). Calcula y reacciona exactamente como las versiones premium más populares de Supertrend que se encuentran en las principales plataformas de gráficos como TradingView.
- 100% Sin Re-pintado: Construido con un mecanismo sólido de memoria de tendencia. Una vez que la tendencia cambia y se imprime una señal, esta permanece. Sin re-pintado, sin flechas que desaparecen y sin errores de recálculo al desplazarse por el historial del gráfico.
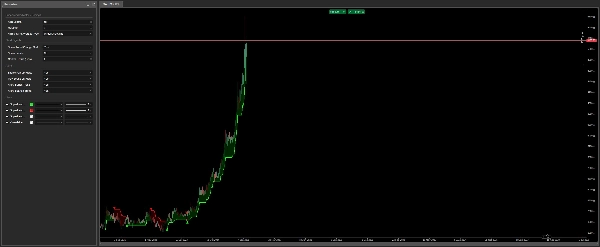
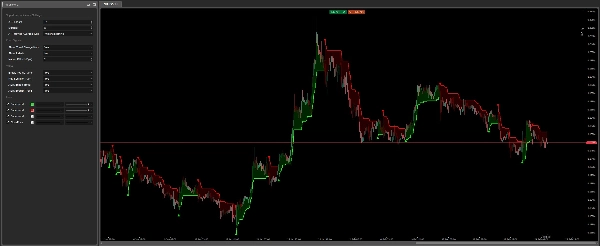
- Simplicidad y Efectividad: El indicador dibuja automáticamente una línea Supertrend que se vuelve verde cuando el mercado está en alza (señal de compra) y roja cuando está en baja (señal de venta). Siempre sabrás exactamente hacia dónde se dirige la tendencia.
- Notificaciones Inteligentes en Tiempo Real: ¡Nunca pierdas una oportunidad de trading! El indicador cuenta con un sistema de alertas mejorado que utiliza ventanas emergentes nativas de cTrader y efectos de sonido integrados. Además, con protección incorporada contra spam, se te alerta exactamente una vez cuando ocurre una señal en tiempo real, sin sonidos molestos al cargar o recargar gráficos.
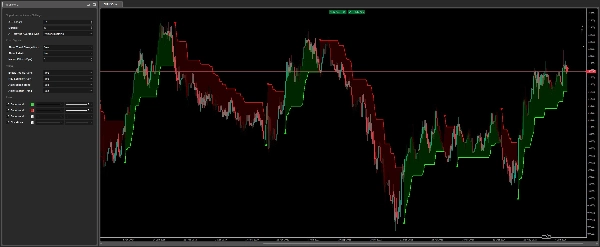
- Señales Visuales Mejoradas y Relleno de Nube: En cada cambio clave de tendencia, verás flechas llamativas y etiquetas de texto opcionales "Alcista"/"Bajista". Un sutil relleno dinámico de nube entre la línea Supertrend y el precio te ayuda a captar fácilmente el impulso del mercado de un vistazo.
- Totalmente Personalizable y Preciso: Ajusta fácilmente configuraciones principales como la longitud y el multiplicador del ATR. También puedes controlar con precisión la distancia de las flechas y etiquetas usando desplazamientos dinámicos basados en pips, asegurando visuales perfectos y sin desorden en cualquier activo.
Indicador Supertrend es perfecto para cualquiera que busque simplificar el análisis del mercado, desde traders principiantes que buscan una forma fácil de detectar tendencias, hasta profesionales experimentados que desean señales altamente precisas y sin re-pintado para sus estrategias. Funciona perfectamente en cualquier mercado: Forex, acciones, índices, criptomonedas y en todos los marcos temporales.
Resumen
Valoraciones de clientes
5 | 33 % | |
4 | 67 % | |
3 | 0 % | |
2 | 0 % | |
1 | 0 % |


