
Descripción
Si buscas un indicador dinámico de canal Fibonacci para cTrader, no busques más. Este indicador dibuja automáticamente bandas de Fibonacci paralelas a una media móvil de tu elección. Es fácil de usar y, como mis otros indicadores, proporciona alertas mediante ventanas emergentes, sonido, correo electrónico y mensajes de Telegram. Además, tienes la flexibilidad de personalizar las Bandas, los niveles de Fibonacci y las Alertas.
Aquí tienes una lista de sus características:
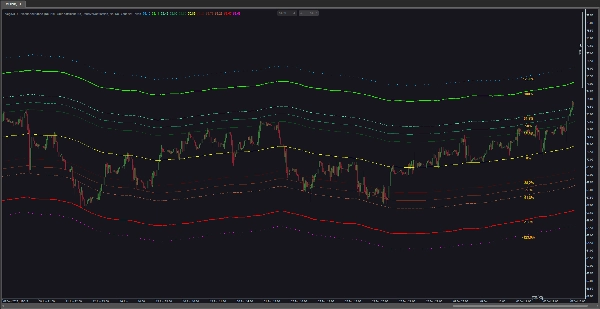
- Cálculo de Bandas de Fibonacci: El indicador calcula y traza bandas de Fibonacci basadas en la media móvil que selecciones. Estas bandas provienen de niveles de Fibonacci (por ejemplo, 0.0%, 38.2%, 61.8% u otros) y se extienden por encima y por debajo de la media móvil por un factor especificado.
- Configuración de la Media Móvil: Personaliza el tipo de media móvil (por ejemplo, Simple, Exponencial, etc.) y el número de periodos usados en el cálculo. La media móvil sirve como base para las bandas de Fibonacci.
- Funcionalidad de Alertas: El indicador ofrece varias opciones de alerta para notificar a los traders sobre eventos específicos. Esto incluye alertas por toque de nivel de precio y alertas de proximidad.
- Alertas por Toque de Nivel de Precio: Configura el indicador para que active alertas cuando el precio toque niveles específicos de Fibonacci. Las alertas pueden basarse en el precio de cierre o inmediatamente cuando el precio toque el nivel.
- Alertas de Proximidad: Configura alertas de proximidad para recibir notificaciones cuando el precio se acerque o se aleje de un nivel de Fibonacci especificado dentro de una distancia definida. Las alertas pueden activarse cuando el precio se aproxima o se distancia del nivel.
- Opciones de Salida de Alertas: Elige entre alertas sonoras, ventanas emergentes, mensajes de Telegram y notificaciones por correo electrónico para las alertas. Las alertas sonoras pueden personalizarse seleccionando diferentes archivos de sonido.
- Opciones de Visualización: Personaliza la visualización de los niveles de Fibonacci con opciones como mostrar valores porcentuales, establecer color para las etiquetas de porcentaje, controlar la ubicación de la etiqueta en el gráfico, habilitar/deshabilitar bandas específicas y elegir color, grosor y apariencia de las bandas.
- Niveles de Fibonacci Configurables: Adapta el indicador a tu estrategia de trading ajustando los niveles específicos de Fibonacci usados en el cálculo. Los niveles positivos y negativos de Fibonacci pueden personalizarse individualmente.
- Guía de Usuario Integrada: Puedes acceder a la guía de usuario de este indicador directamente desde el gráfico.
En resumen, el indicador VegaXLR - Bandas de Fibonacci combina el análisis de Fibonacci y medias móviles para ayudar a identificar posibles niveles de soporte y resistencia. Con funcionalidad de alertas configurable y opciones de visualización, es una herramienta invaluable para traders que dependen de retrocesos o expansiones de Fibonacci.
Resumen
It features multiple alert options including price level touch alerts—triggered on price contact or close at specified Fibonacci levels—and proximity alerts that notify when price approaches or moves away from these levels within a defined range. Alerts can be delivered via pop-up, sound (with customizable sounds), email, and Telegram messages.
Visualization settings enable customization of band colors, thickness, label display and position, and selective enabling or disabling of bands. A built-in user guide is accessible directly from the chart for ease of use.
Overall, VegaXLR - Fibonacci Bands combines Fibonacci retracement and expansion analysis with moving averages to assist traders in identifying potential support and resistance zones, enhanced by configurable alerts and visualization options.
Valoraciones de clientes
5 | 100 % | |
4 | 0 % | |
3 | 0 % | |
2 | 0 % | |
1 | 0 % |


