
Mô tả
Trình diễn:
Chỉ báo RSI - chỉ báo này là một phiên bản nâng cao nhưng gọn gàng của bộ dao động Chỉ số Sức mạnh Tương đối (RSI) cổ điển dành cho nền tảng cTrader. Nó được phát triển hoàn toàn theo đúng chỉ báo gốc từ TradingView (dựa trên đặc tả chính thức của họ).
Nhờ sử dụng mô hình làm mượt RMA (Running Moving Average), chỉ báo này hoạt động và vẽ biểu đồ chính xác như phiên bản trên TradingView. Chúng tôi cũng đảm bảo trải nghiệm hình ảnh hoàn toàn tương thích.
Các tính năng và chức năng chính:
- Tương thích 100% với TradingView: Thuật toán sử dụng logic tính toán chính xác như chỉ báo TV gốc (dựa trên công thức RMA).
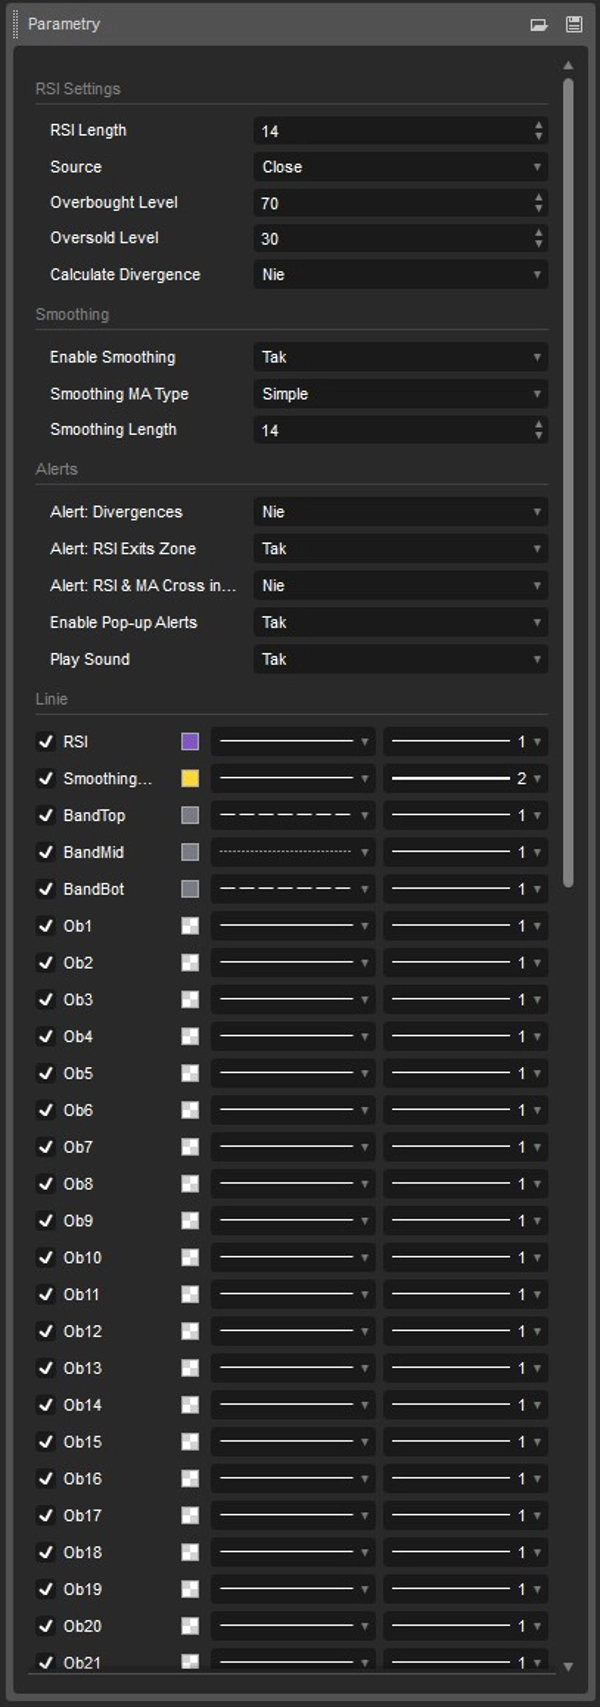
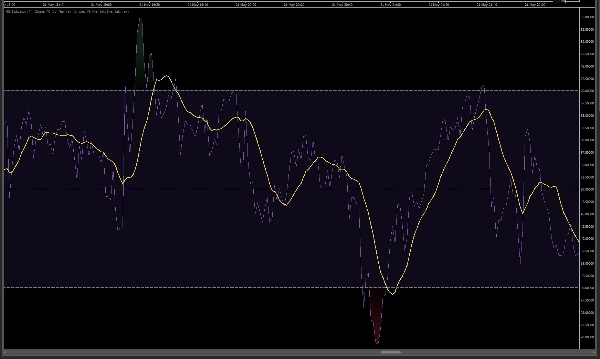
- Thiết kế hình ảnh ấn tượng (Gradient động): Hệ thống tô màu 30 cấp độ sáng tạo được áp dụng. RSI càng di chuyển vào vùng quá mua (trên 70) thì nền đỏ càng đậm. RSI càng giảm xuống vùng quá bán (dưới 30) thì màu xanh lá càng sâu. Vùng giữa giữ tông màu tím cổ điển.
- Đường Trung bình Động (MA) tích hợp: Như trong các phiên bản TV mới nhất, bạn có thể bật đường trung bình động (ví dụ SMA) để làm mượt đường RSI và giúp nhận diện xu hướng ngay trong bộ dao động.
- Phát hiện Phân kỳ Tự động: Chỉ báo có thể tự động quét biểu đồ để tìm các phân kỳ thường. Khi phát hiện sự không khớp giữa giá và sức mạnh xu hướng RSI, nó sẽ vẽ các đường và dấu hiệu (Tăng giá: màu xanh lá, Giảm giá: màu đỏ) ngay trong cửa sổ chỉ báo.
- Hệ thống Cảnh báo Mạnh mẽ (Cửa sổ bật lên & Âm thanh): Luôn cập nhật kịp thời. Chỉ báo sẽ thông báo cho bạn khi:
-
- RSI thoát khỏi vùng quá mua/quá bán (tạo tín hiệu mua/bán cổ điển),
- Đường RSI cắt đường MA sâu trong các vùng này,
- Phát hiện phân kỳ mới.
Chỉ báo này dành cho ai?
Nếu bạn quen phân tích RSI trên TradingView, đang tìm kiếm tín hiệu hoàn toàn tương thích trên cTrader, và đánh giá cao thiết kế sạch sẽ, hấp dẫn về mặt hình ảnh (không cần chỉnh màu thủ công), thì chỉ báo này là giải pháp lý tưởng.
Dễ sử dụng, chính xác trong vận hành, và trung thành với bản gốc!
cGuru


