
Deskripsi
Market Cipher A adalah indikator teknis canggih yang dirancang untuk analisis mudah, identifikasi, dan prediksi tren makro di pasar cryptocurrency.
Struktur dan Komponen
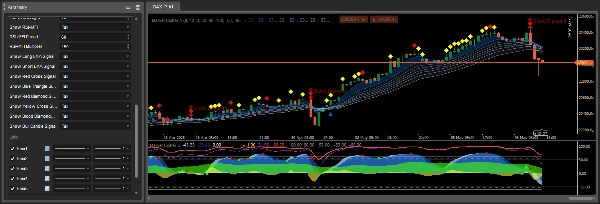
Market Cipher A terdiri dari pita 8 rata-rata bergerak eksponensial (EMA) yang berubah warna tergantung pada tren pasar. Pita EMA berubah menjadi biru atau putih selama pasar bullish dan abu-abu selama pasar bearish.
Secara default, rata-rata bergerak dengan nilai EMA dari 5 hingga 34 digunakan. Persilangan garis-garis ini bisa menjadi indikator lag yang sangat kuat, itulah sebabnya Market Cipher A diprogram untuk secara otomatis menampilkan simbol yang sesuai dengan sinyal yang berbeda, menghilangkan kebutuhan interpretasi manual dari setiap persilangan bullish atau bearish.
Simbol dan Sinyal Perdagangan
Market Cipher A menampilkan simbol khas langsung pada grafik candlestick yang menunjukkan peluang perdagangan potensial:
Segitiga Biru - sinyal pembalikan tren, menunjukkan momentum yang menurun dan pembalikan yang akan datang. Ini adalah peringatan dini bahwa momentum tren sedang menurun.
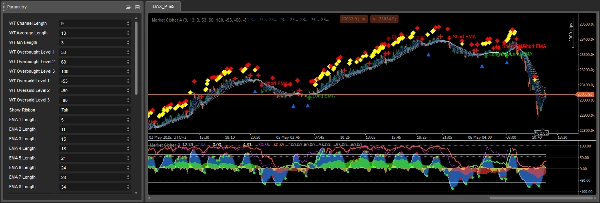
Lingkaran Hijau - indikator bullish, paling dapat diandalkan pada kerangka waktu 6 jam ke atas. Biasanya muncul setelah segitiga biru dan harus diinterpretasikan dalam rentang 1-3 candle.
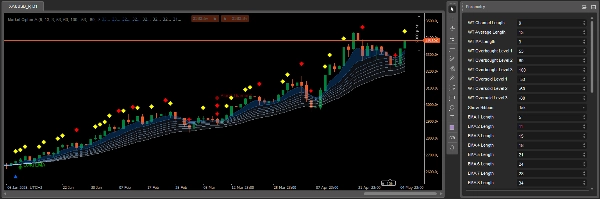
Berlian Kuning - menunjukkan kelanjutan tren naik. Harus digunakan bersama dengan pita EMA untuk konfirmasi arah tren yang lebih baik.
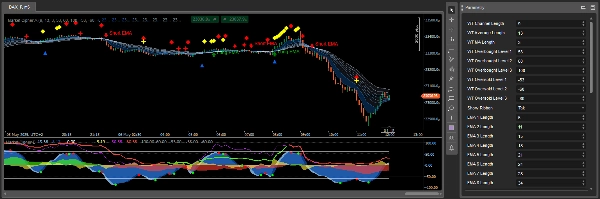
Berlian Merah - menandakan pelemahan tren dan kemungkinan kelanjutan ke bawah. Menunjukkan peningkatan momentum ke bawah.
X Merah - indikator bearish, paling efektif pada kerangka waktu 1 jam ke atas. Harus digunakan bersama dengan pita EMA dan berlian merah.
X Kuning - menunjukkan manipulasi pasar, terutama penutupan posisi long besar yang dengan cepat dibeli dan dijual oleh posisi short.
Berlian Merah Besar (Blood Diamond) - sinyal paling bearish, menunjukkan probabilitas tinggi penurunan, terutama ketika terjadi bersamaan dengan X merah atau berlian merah kecil.
Prinsip Penggunaan
Market Cipher A memberikan dukungan atau resistensi matematis yang kuat secara visual, memungkinkan pemahaman mudah tentang lingkungan perdagangan. Ini bekerja paling baik dengan candle Heiken Ashi.
Pita EMA tidak hanya menunjukkan tren tetapi juga berfungsi sebagai level support dan resistance dinamis. Ketika pita berwarna biru/putih dan candle berada di atasnya, Anda dapat mencari peluang untuk mengambil posisi long. Ketika pita berwarna abu-abu dan candle berada di bawahnya, Anda dapat mempertimbangkan posisi short.
Hasil terbaik dicapai ketika sinyal dari Market Cipher A digabungkan dengan indikator lain dari paket Market Cipher, terutama Market Cipher B, yang memberikan sinyal momentum tambahan dan titik masuk.
Interpretasi Sinyal Detail dalam Konteks Tren
Aspek penting dari Market Cipher A adalah interpretasi sinyal kontekstual tergantung pada tren dominan. Ketika pita berubah warna dari abu-abu menjadi biru, indikator menghasilkan lingkaran hijau sebagai sinyal awal tren naik. Biasanya, setelah lingkaran hijau, jika 1-3 candle berikutnya menampilkan berlian kuning, probabilitas terjadinya breakout tinggi. Namun, jika muncul berlian merah, breakout menjadi kurang mungkin.
Selama pasar bullish, berlian kuning menguntungkan, menunjukkan kelanjutan naik yang sejalan dengan tren, sementara berlian merah mewakili pergerakan berlawanan tren. Dalam pasar bearish, situasinya terbalik - berlian merah menguntungkan sebagai kelanjutan penurunan, dan berlian kuning menunjukkan pergerakan naik sementara yang berlawanan dengan tren.
X merah paling dapat diandalkan ketika muncul setelah berlian merah dan pita EMA hampir sepenuhnya menyempit, berubah warna menjadi abu-abu bearish. Akurasi indikator ini bervariasi tergantung pada kerangka waktu.
Mekanisme Operasi dan Genesis Sinyal
Simbol dan sinyal dalam Market Cipher A dihasilkan berdasarkan beberapa sumber: persilangan gelombang WaveTrend, level jenuh beli dan jenuh jual, serta berdasarkan RSI dan MFI ketika mereka melintasi garis tengah atau mencapai kondisi jenuh beli dan jenuh jual. Analisis multidimensi ini membuat sinyal lebih komprehensif dibandingkan indikator tunggal.
Pita EMA terdiri dari 8 rata-rata bergerak yang membentuk pita khas dengan pemisahan antara pita individu. Pemisahan pita adalah faktor penting - pemisahan lebar menunjukkan tren kuat, sementara pita yang menyempit menunjukkan momentum melemah atau konsolidasi.
Aplikasi Praktis dalam Strategi Perdagangan
Market Cipher A dirancang terutama sebagai alat analisis tren, sehingga bekerja paling baik dalam strategi mengikuti tren. Disarankan menggunakan pita bersama dengan indikator identifikasi tren lainnya, kemudian mencari peluang perdagangan selama penarikan harga.
Penting untuk diingat bahwa sinyal ini membantu menyempurnakan waktu masuk atau keluar dari perdagangan, tetapi tidak boleh digunakan sendiri untuk membuat keputusan perdagangan. Konfirmasi tambahan diperlukan, terutama untuk sinyal pembalikan yang terjadi selama pergerakan harga datar.
Ringkasan
The indicator automatically displays distinct symbols on the price chart to signal potential trading opportunities:
- Blue Triangle: signals declining momentum and possible trend reversal.
- Green Circle: indicates a bullish trend start, most reliable on 6-hour timeframes and above.
- Yellow Diamonds: suggest continuation of an upward trend.
- Red Diamonds: indicate trend weakening and potential downward continuation.
- Red X: bearish signal effective on 1-hour timeframes and higher.
- Yellow X: points to market manipulation events.
- Large Red Diamond ("Blood Diamond"): strong bearish signal with high probability of decline.
Signals are generated using a combination of WaveTrend crossovers, RSI, and MFI indicators, providing multidimensional market analysis. Market Cipher A is optimized for use with Heiken Ashi candles and is best applied within trend-following strategies, ideally combined with other Market Cipher indicators for enhanced entry and momentum confirmation.
Ulasan pelanggan
5 | 67 % | |
4 | 33 % | |
3 | 0 % | |
2 | 0 % | |
1 | 0 % |


