
HIGHS LOWS AEGIS
Indikator
1 pembelian
Versi 1.0, Dec 2025
Windows, Mac
5.0
Ulasan: 2
Deskripsi
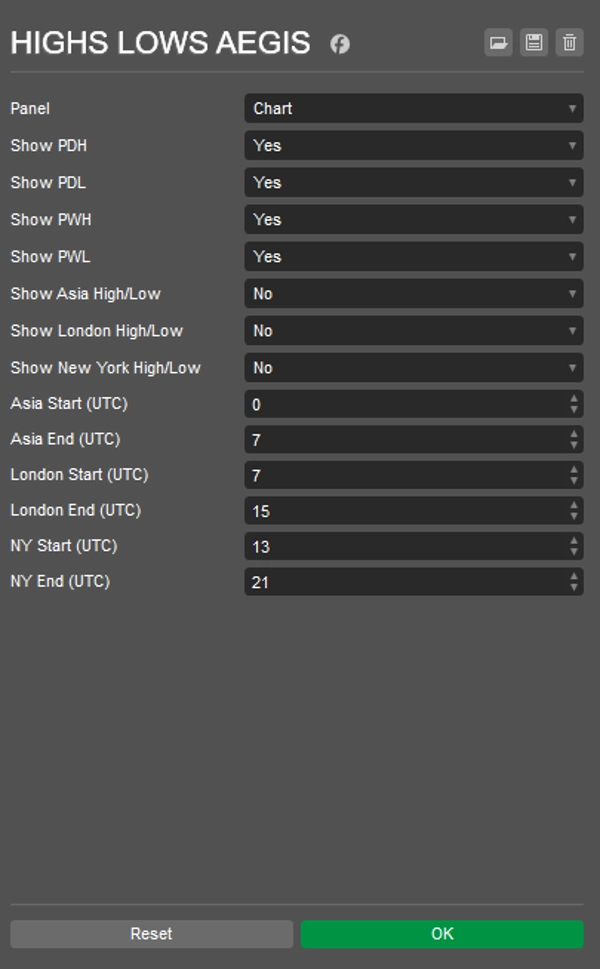
Indikator sederhana yang menunjukkan Highs dan Lows yang dipilih.
- Low/High Hari Sebelumnya
- Low/High Minggu Sebelumnya
- Low/High sesi Asia/London/New York
- Waktu UTC yang dapat disesuaikan untuk setiap awal/akhir sesi
Garis berlabel untuk melihat dengan lebih jelas apa yang mana.
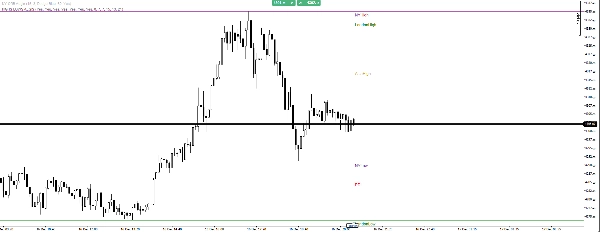
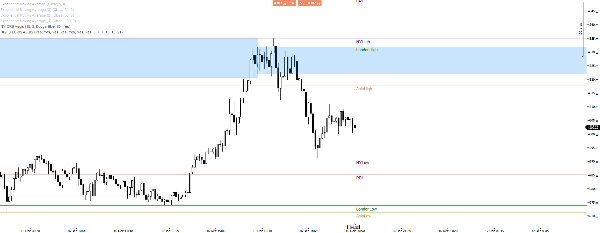
Penggunaan yang baik dengan hampir semua strategi, saya menggunakannya dengan ORB, yang sangat membantu menghindari breakout palsu, seperti pada gambar hari ini dengan XAUUSD.
Ringkasan
Profil indikator
Ulasan pelanggan
5.0
Ulasan: 2
5 | 100 % | |
4 | 0 % | |
3 | 0 % | |
2 | 0 % | |
1 | 0 % |
Ulasan pelanggan
December 27, 2025
December 24, 2025
weak ideas are easier to skip, but it should stay in the support stack.
Diskusi
Pertanyaan umum
Prop
Forex
Breakout
Scalping
Indices
EURUSD
Commodities
SMC
Stocks
XAUUSD
NAS100
Produk-produk yang tersedia melalui cTrader Store, termasuk bot trading, indikator, dan plugin, disediakan oleh pengembang pihak ketiga serta hanya ditujukan untuk akses teknis dan informasi. cTrader Store bukan broker dan tidak menyediakan saran investasi, rekomendasi pribadi, atau jaminan apa pun tentang kinerja di masa mendatang.


Harga
Sejak 14/04/2025
1
Penjualan