
Описание
ИНСТИТУЦИОНАЛЬНЫЙ ПРОФИЛЬ ОБЪЁМА - Продвинутый инструмент анализа рынка
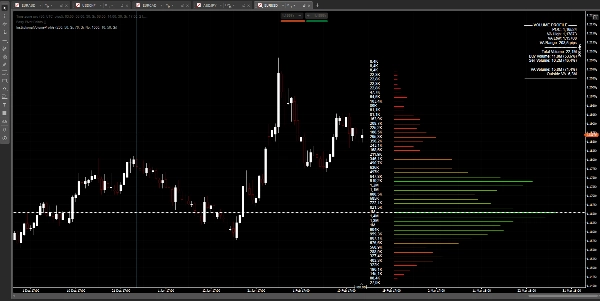
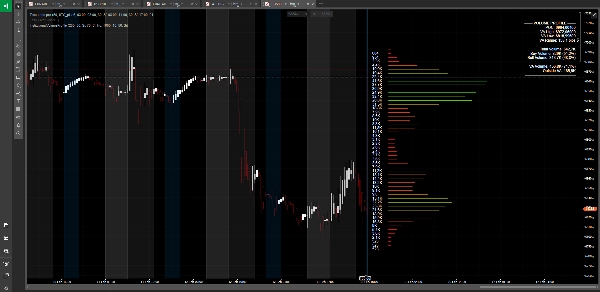
Узнайте, где институциональные трейдеры занимают позиции с помощью этого профессионального индикатора профиля объёма. В отличие от базовых инструментов объёма, этот индикатор раскрывает истинную структуру рынка, показывая вам точно, где происходила основная торговая активность.
КЛЮЧЕВЫЕ ОСОБЕННОСТИ:
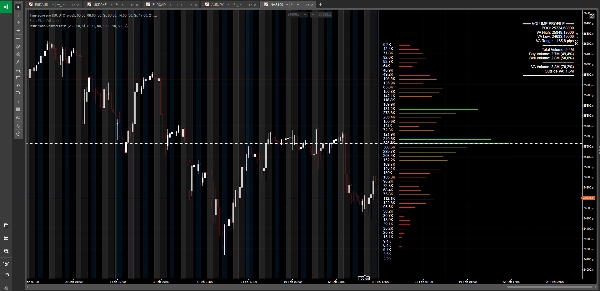
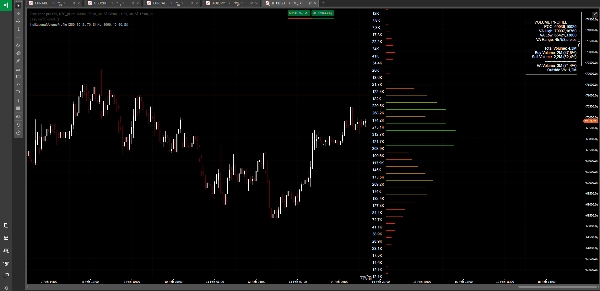
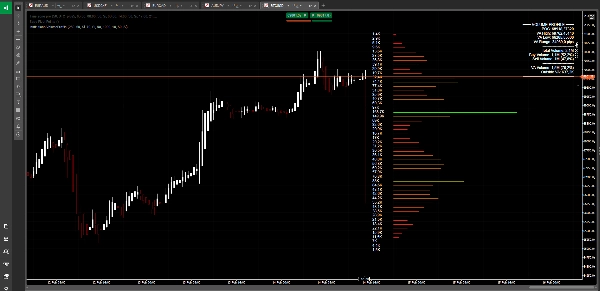
🎯 Точка контроля (POC)
Мгновенно определяйте ценовой уровень с наибольшим объёмом торгов — точку равновесия рынка, где сосредоточена институциональная активность.
📊 Анализ зоны стоимости
Визуализируйте ценовой диапазон, содержащий 70% всего объёма торгов. Здесь существует «справедливая стоимость» и к этому уровню цена обычно стремится.
💹 Анализ настроений покупателей/продавцов
Увидьте баланс сил между покупателями и продавцами с разбивкой в процентах в реальном времени. Узнайте, кто контролирует рынок — быки или медведи.
🎨 Умный градиент цвета
Зоны с высоким объёмом отображаются ярко-зелёным, а зоны с низким объёмом — красным. Мгновенно определяйте зоны ликвидности и потенциальные области прорыва.
📈 Профессиональная презентация
Чистое, ненавязчивое отображение с объёмными барами, отходящими от ценового действия. Цифры чётко расположены для удобного чтения на любом уровне масштабирования.
⚙️ Полная настройка
Настраивайте период анализа, количество ценовых уровней, цвета и параметры отображения в соответствии с вашим стилем торговли.
ИДЕАЛЬНО ПОДХОДИТ ДЛЯ:
• Определения ключевых уровней поддержки и сопротивления
• Обнаружения узлов с низким объёмом (LVN) для потенциальных прорывов
• Поиска узлов с высоким объёмом (HVN), где цена может консолидироваться
• Понимания институционального позиционирования
• Подтверждения входов и выходов из сделок
• Мультивременного анализа
Будь вы дейтрейдером, свинг-трейдером или позиционным трейдером, этот инструмент даст вам преимущество, показывая то, что традиционные индикаторы не могут: где работает умные деньги.
---
⚠️ ОТКАЗ ОТ ОТВЕТСТВЕННОСТИ ЗА РИСКИ:
Торговля на рынке форекс, криптовалютами и другими финансовыми инструментами связана с высоким уровнем риска и может не подходить всем инвесторам. Высокая степень кредитного плеча может работать как против вас, так и в вашу пользу. Перед принятием решения о торговле вы должны тщательно оценить свои инвестиционные цели, уровень опыта и склонность к риску. Существует вероятность потерять часть или весь ваш капитал. Поэтому не инвестируйте деньги, которые не можете позволить себе потерять. Вы должны быть осведомлены обо всех рисках, связанных с торговлей, и при наличии сомнений обратиться за советом к независимому финансовому консультанту. Прошлые результаты не гарантируют будущих.
Сводка
- Point of Control (POC): Identifies the price level with the highest trading volume, indicating market equilibrium.
- Value Area Analysis: Displays the price range containing 70% of trading volume, representing the "fair value" zone.
- Buy/Sell Sentiment Analysis: Provides real-time percentage breakdowns of buying and selling pressure.
- Smart Color Gradient: Uses color coding to distinguish high-volume zones (bright green) from low-volume zones (red), aiding in spotting liquidity and breakout areas.
- Professional Presentation: Volume bars extend from price action with clear numeric labels, optimized for readability at any zoom level.
- Full Customization: Allows adjustment of lookback period, price levels, colors, and display settings.
This tool supports multi-timeframe analysis and is suitable for identifying key support/resistance levels, spotting low- and high-volume nodes, understanding institutional positioning, and confirming trade entries and exits. It is applicable across markets including Forex, indices, and symbols like XAUUSD and NAS100.
Отзывы покупателей
5 | 33 % | |
4 | 33 % | |
3 | 0 % | |
2 | 33 % | |
1 | 0 % |


![Логотип продукта "[Stellar Strategies] Smart ADX"](https://cdn.ctrader.com/image/webp/af13b084-b6f6-41db-b7bc-c7e688b57b05_36929)


