Descrição
Indicador de Topos e Fundos Principais: Uma Visão Abrangente
Introdução
No mundo acelerado do trading, ter as ferramentas certas à sua disposição pode fazer toda a diferença. O indicador de Topos e Fundos Principais foi projetado para identificar pontos críticos de reversão no mercado, permitindo que os traders tomem decisões informadas. Esta ferramenta poderosa utiliza algoritmos avançados para localizar máximas e mínimas significativas, aprimorando sua estratégia de trading e melhorando seu desempenho geral. Com uma taxa média de precisão em torno de 60% a 70% no timeframe de 45 minutos, este indicador é um ativo confiável para traders que buscam capitalizar os movimentos do mercado, tornando-o ideal tanto para day traders quanto para scalpers.
Principais Características
1. Representação Visual
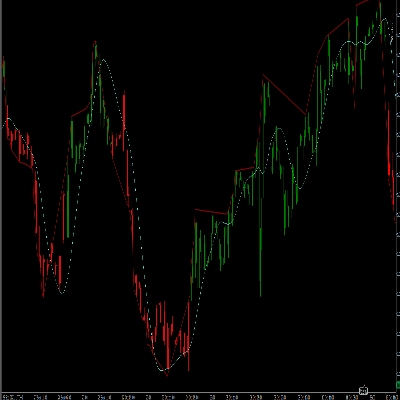
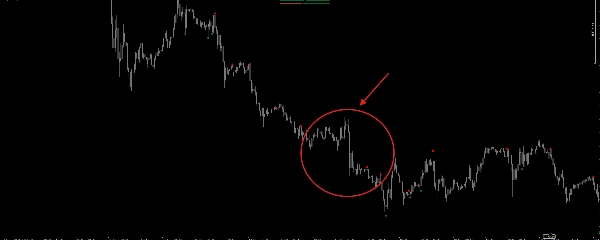
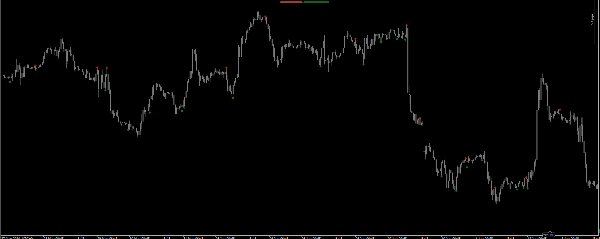
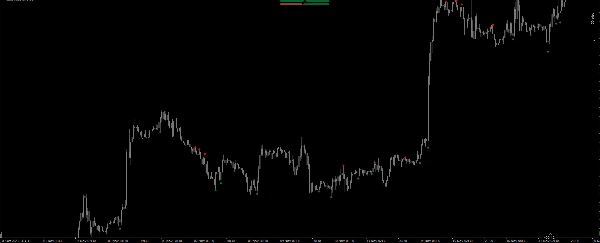
O indicador de Topos e Fundos Principais oferece uma representação visual clara da dinâmica do mercado. Com topos principais marcados em vermelho e fundos principais em verde, os traders podem identificar rapidamente potenciais pontos de reversão. O uso de pontos garante que esses níveis críticos se destaquem no gráfico, facilitando a identificação de oportunidades de trading à primeira vista.
2. Cálculos Precisos
O núcleo do indicador de Topos e Fundos Principais está em seu método de cálculo. Ao analisar a ação do preço das últimas quatro barras, o indicador determina se um topo ou fundo principal foi formado. Isso é alcançado por meio de uma série de comparações dos preços máximos e mínimos, garantindo que apenas pontos de reversão significativos sejam identificados.
3. Técnicas Aprimoradas de Scalping
Para traders que se especializam em scalping, o indicador de Topos e Fundos Principais é um recurso inestimável. Ao identificar pontos-chave de reversão, os traders podem entrar e sair de posições com precisão. A capacidade de identificar rapidamente topos e fundos principais permite colocações apertadas de take profit (TP) e stop loss (SL), minimizando o risco enquanto maximiza os ganhos potenciais. Dada sua precisão de cerca de 60% a 70% em timeframes de 45 minutos, é altamente recomendável usar stop losses para mitigar perdas potenciais quando um sinal for perdido.
Benefícios do Uso do Indicador de Topos e Fundos Principais
1. Tomada de Decisão Aprimorada
O indicador de Topos e Fundos Principais capacita os traders a tomar decisões informadas com base em análises precisas do mercado. Ao identificar máximas e mínimas significativas, os traders podem antecipar melhor os movimentos de preço e ajustar suas estratégias de acordo. Esse processo aprimorado de tomada de decisão melhora o desempenho geral do trading.
2. Potencial de Lucro Aumentado
Com a capacidade de identificar pontos críticos de reversão, os traders podem capitalizar as reversões do mercado de forma mais eficaz. O indicador de Topos e Fundos Principais permite que os traders entrem em posições nos momentos ideais, aumentando seu potencial de lucro. Ao utilizar níveis apertados de TP e SL, os traders podem maximizar seus ganhos enquanto minimizam sua exposição ao risco.
3. Interface Amigável
O indicador de Topos e Fundos Principais foi projetado com a experiência do usuário em mente. A representação visual clara dos topos e fundos principais garante que os traders possam interpretar facilmente os sinais fornecidos pelo indicador. Esta interface amigável torna-o acessível para traders de todos os níveis de experiência.
4. Aplicação Versátil
Seja você um day trader, swing trader ou scalper, o indicador de Topos e Fundos Principais pode ser aplicado em várias estratégias de trading. Sua versatilidade o torna uma adição valiosa ao conjunto de ferramentas de qualquer trader, permitindo maior flexibilidade para se adaptar a diferentes condições de mercado.
Conclusão
Em conclusão, o indicador de Topos e Fundos Principais é uma ferramenta poderosa que aprimora estratégias de trading ao identificar pontos críticos de reversão do mercado. Com seus cálculos precisos, representação visual e compatibilidade com a plataforma cTrader, este indicador capacita os traders a tomar decisões informadas e capitalizar os movimentos do mercado. Com uma taxa de precisão em torno de 70%, é crucial implementar stop losses para minimizar perdas quando um sinal for perdido. Para resultados ótimos, recomenda-se usar este indicador em um timeframe de 45 minutos. Seja você um trader experiente ou iniciante, o indicador de Topos e Fundos Principais pode melhorar significativamente seu desempenho no trading. Eleve sua experiência de trading hoje incorporando esta ferramenta inovadora em sua estratégia.
Resumo
Avaliações de clientes
5 | 50 % | |
4 | 50 % | |
3 | 0 % | |
2 | 0 % | |
1 | 0 % |