Описание
Pair Strength (JPY) - Индикатор силы валюты
📊 Что такое Pair Strength (JPY)?
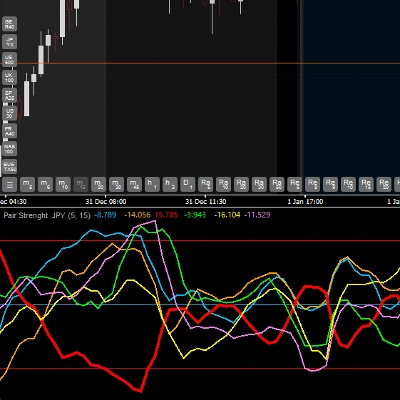
Pair Strength (JPY) — это продвинутый индикатор, который анализирует и сравнивает относительную силу 6 основных валют в реальном времени: EUR, GBP, JPY, USD, AUD и CAD. Он использует индекс истинной силы (TSI) для измерения импульса и силы каждой валюты, позволяя определить, какие валюты сильнее или слабее на рынке.
🎯 Основные функции
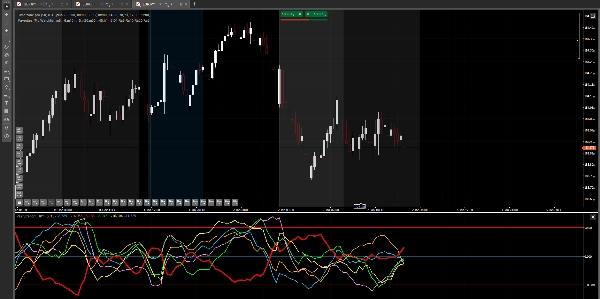
✅ Мультивалютный анализ: Отслеживайте 6 валют одновременно в одном окне ✅ Определение тренда: Выявляйте самые сильные и слабые валюты на рынке ✅ Сигналы перекупленности/перепроданности: Уровни на 50, 0 и -50 для определения экстремумов ✅ Подтверждение сделок: Помогает подтвердить входы, сравнивая относительную силу ✅ Визуально и понятно: Каждая валюта имеет свой цвет для удобства идентификации
💹 Совместимые пары
ВАЖНО: Этот индикатор анализирует силу 6 валют: EUR, GBP, JPY, USD, AUD и CAD
Индикатор работает ТОЛЬКО с парами, включающими JPY (японская иена), а именно:
- EURJPY (евро / иена)
- GBPJPY (фунт / иена)
- USDJPY (доллар / иена)
- AUDJPY (австралийский доллар / иена)
- CADJPY (канадский доллар / иена)
⚠️ Ваш брокер ДОЛЖЕН предлагать эти 5 пар с JPY для корректной работы индикатора.
Не работает с:
- золотом, серебром или другими металлами
- фондовыми индексами
- криптовалютами
- парами, не включающими JPY (например, EURUSD, GBPUSD и др.)
Вы можете применить индикатор на графике любой из 5 указанных выше пар.
📈 Как использовать индикатор
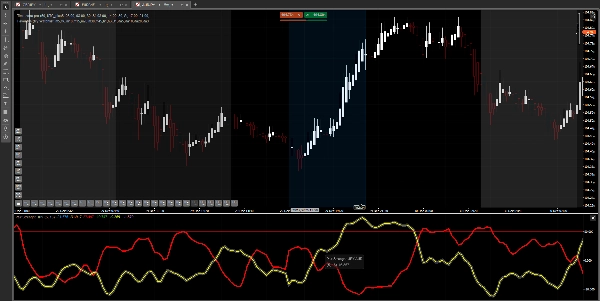
Интерпретация линий:
Каждая цветная линия представляет силу валюты:
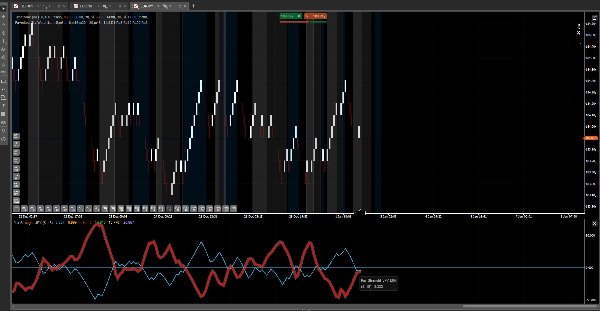
- Линия вверх (положительные значения): Валюта СИЛЬНА
- Линия вниз (отрицательные значения): Валюта СЛАБА
- Пересечения линий: Изменение относительной силы между валютами
Ключевые уровни:
- Уровень 50: Зона перекупленности — валюта может быть очень сильной и близкой к развороту
- Уровень 0: Нейтральная линия — баланс между силой и слабостью
- Уровень -50: Зона перепроданности — валюта может быть очень слабой и близкой к развороту
Базовая стратегия:
- Определите САМУЮ СИЛЬНУЮ валюту (самая высокая линия)
- Определите САМУЮ СЛАБУЮ валюту (самая низкая линия)
- Торгуйте парой, объединяющей обе (пример: если EUR сильна, а JPY слаба → покупайте EURJPY)
- Подтверждайте уровнями: Избегайте покупок, когда сильная валюта на +50, или продаж, когда слабая на -50
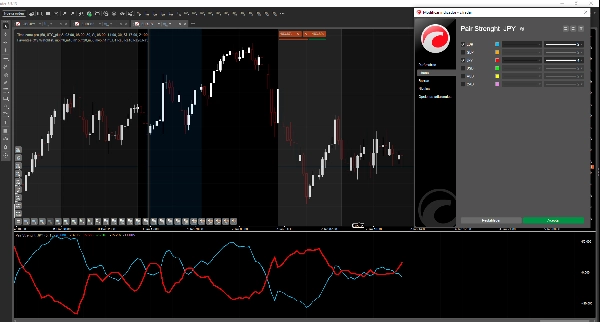
⚙️ Настраиваемые параметры
- Быстрый период (по умолчанию: 5): Быстрый период TSI — меньшие значения = более чувствительный
- Медленный период (по умолчанию: 15): Медленный период TSI — большие значения = более сглаженный
Значения по умолчанию хорошо подходят для большинства ситуаций. Настраивайте их в соответствии с вашим стилем торговли.
🔮 Будущие обновления
Мы рассматриваем возможность добавления большего количества валютных пар (NZD, CHF и др.) в будущих версиях, в зависимости от откликов и отзывов пользователей. Однако это не гарантировано и будет зависеть от производительности индикатора и спроса на рынке.
💡 Советы по использованию
✓ Используйте в сочетании с вашей основной стратегией, а не как самостоятельную систему ✓ Комбинируйте с анализом ценового действия и уровнями поддержки/сопротивления ✓ Сначала практикуйтесь на демо-счете перед торговлей на реальном ✓ Не все сигналы являются выигрышными — применяйте правильное управление рисками ✓ Лучше всего работает на таймфреймах M15 и выше
📞 Поддержка
Если у вас есть вопросы по установке или использованию индикатора, свяжитесь с нами.
Заключительное замечание: Этот индикатор является инструментом анализа. Успех в торговле зависит от множества факторов, включая управление рисками, психологию и опыт.
Сводка
This tool works exclusively with currency pairs that include the Japanese Yen (JPY), specifically EURJPY, GBPJPY, USDJPY, AUDJPY, and CADJPY. It does not support metals, stock indices, cryptocurrencies, or pairs without JPY. Users apply the indicator on any of the five JPY pairs to monitor multi-currency strength simultaneously in one window.
Adjustable parameters include the fast and slow periods of the TSI for sensitivity and smoothing. The indicator aids in trend identification, overbought/oversold signal detection, and trade confirmation by comparing relative currency strength. It is recommended for use alongside other analysis methods and on timeframes of 15 minutes or higher.
Отзывы покупателей
5 | 100 % | |
4 | 0 % | |
3 | 0 % | |
2 | 0 % | |
1 | 0 % |


![Логотип продукта "[Stellar Strategies] Inside Bar with Signals"](https://cdn.ctrader.com/image/webp/1d9e8bfa-3b2c-4440-bb37-5856902008a7_30683)


