Описание
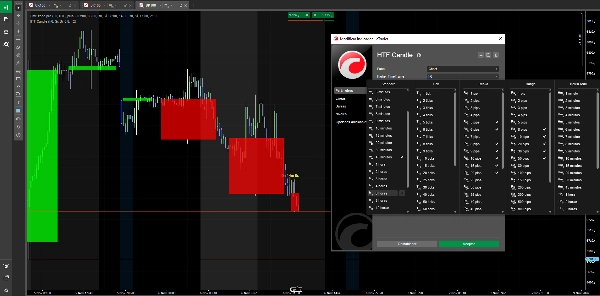
HTF Candle - Визуализируйте рынок как профессионалы.
Преобразите свою торговлю с профессиональной визуальной ясностью
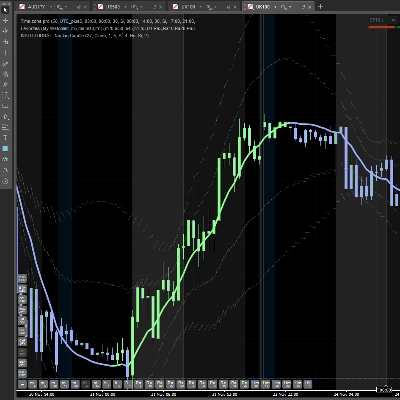
Устали постоянно переключаться между таймфреймами, чтобы понять реальный рыночный тренд? HTF Candle дает вам преимущество: визуализируйте несколько таймфреймов одновременно, не теряя детализации текущего графика.
Почему вам нужен HTF Candle
Принимайте более умные решения, мгновенно видя структуру более высокого таймфрейма при торговле на вашем любимом таймфрейме. Профессиональные трейдеры всегда анализируют несколько таймфреймов — теперь можете и вы, без лишних хлопот.
Обнаруживайте возможности, которые другие пропускают. Пока другие трейдеры путаются в рыночном шуме на меньших таймфреймах, вы увидите полную картину: где находятся реальные уровни поддержки, сопротивления и доминирующие тренды.
Синхронизируйте свои входы с институциональным потоком. Когда ваш торговый таймфрейм совпадает с направлением более высокого таймфрейма, вероятность успеха возрастает.
Ключевые преимущества:
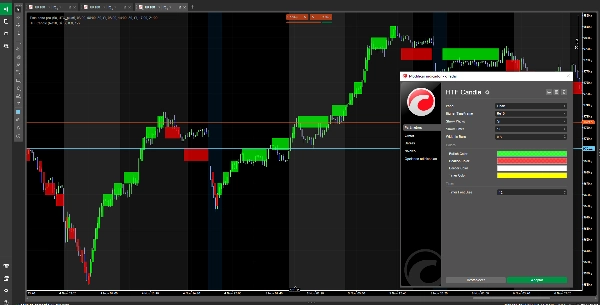
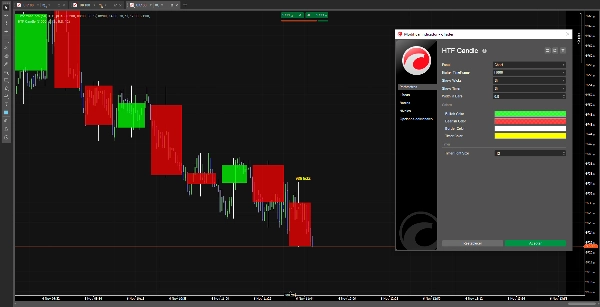
✅ Обновления в реальном времени - Свечи более высокого таймфрейма движутся вместе с вами, показывая каждое изменение рынка мгновенно
✅ Умный таймер - Точно знайте, когда закроется следующая свеча более высокого таймфрейма, чтобы планировать сделки с хирургической точностью
✅ Полная совместимость - Идеально работает с тайм-базированными, тиковыми и любыми типами графиков, которые вы используете
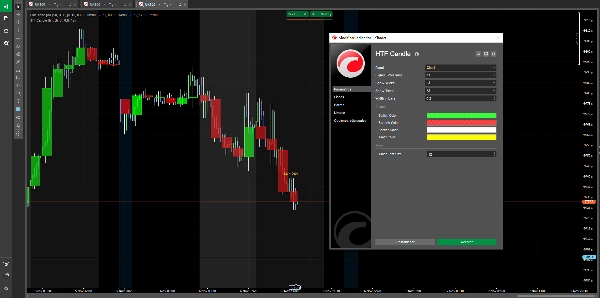
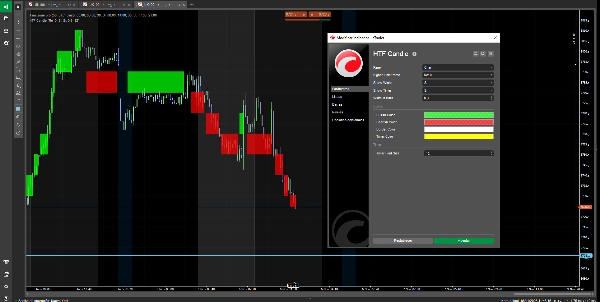
✅ Полная настройка - Настраивайте цвета, размеры и стили под вашу стратегию и визуальные предпочтения
✅ Отсутствие перерисовки - Что видите, то и получаете. Без сюрпризов и изменений после закрытия свечи
Для кого этот индикатор?
- Скальперы, которым нужен контекст более высокого таймфрейма для фильтрации сигналов
- Дейтрейдеры, желающие подтверждать тренды перед входом в сделку
- Свинг-трейдеры, ищущие точные точки входа, согласованные с основным трендом
- Трейдеры Price Action, которым нужна ясность в рыночной структуре
Секрет мульти-таймфреймной торговли, упрощённый
Проигрывающие трейдеры работают вслепую на одном таймфрейме. Выигрывающие понимают, что рынок фрактален, и нужно видеть весь лес, а не только дерево перед собой.
HTF Candle дает вам это превосходное видение без усложнения вашей жизни.
Больше никаких множества окон. Больше никакой путаницы. Только ясность, точность и полный контроль над вашим анализом.
Инвестируйте в своё конкурентное преимущество
В торговле правильная информация в нужное время — это деньги. Сколько для вас стоит принимать решения с уверенностью, видя то, что видят профессиональные трейдеры?
Скачайте HTF Candle сейчас и начните торговать с визуальным преимуществом, которого заслуживает ваша торговля.
Совместимо со всеми версиями cTrader. Поддержка включена. Бесплатные обновления.
Сводка
Key features include a smart timer indicating when the next higher timeframe candle will close, full compatibility with time-based, tick-based, and various chart types, and extensive customization options for colors, sizes, and styles. The indicator ensures zero repainting, meaning the displayed candles do not change after closing, providing reliable visual data.
HTF Candle supports multiple markets including Forex, Indices, Commodities, and Crypto. It is suitable for scalpers, day traders, swing traders, and price action traders who require higher timeframe context to improve decision-making and align entries with broader market trends. The indicator is compatible with all cTrader versions and offers support and updates.
Отзывы покупателей
5 | 50 % | |
4 | 50 % | |
3 | 0 % | |
2 | 0 % | |
1 | 0 % |