
KANDIKA HEAT MAP
Индикатор
1 покупки
Версия 1.0, Jul 2025
Windows, Mac
4.6
Отзывы: 3
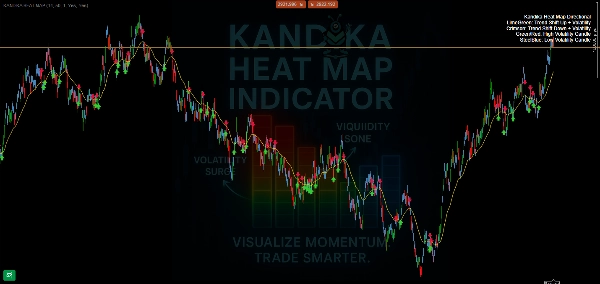
🎨 Цветовая логика – что она вам говорит
- 🟩 Лаймово-зеленый → Смена тренда вверх
Формируется бычье изменение импульса. Используйте это, чтобы поймать ранний рост. - 🟥 Малиновый → Смена тренда вниз
Сигнализирует о нарастании давления снижения. Готовит вас к возможным шортам или выходам. - 🟧/🔴 Оранжевый/Красный → Зона высокой волатильности
Ожидайте резких скачков цены, быстрых движений и возможных ловушек. Не место для слепых догадок — подтверждайте свою стратегию. - 🟦 Стальной синий → Зона низкой волатильности
Рынок замедляется, сжимается или находится в боковом движении. Часто подготавливает возможности для прорыва.
📊 Что это делает (и чего не делает)
- ✅ Четко отображает изменения направления тренда
- ✅ Визуально разделяет спокойные и волатильные зоны
- ✅ Простой, удобный для графиков оверлей — без загромождений
Профиль индикатора
4.6
Отзывы: 3
5 | 67 % | |
4 | 33 % | |
3 | 0 % | |
2 | 0 % | |
1 | 0 % |
Отзывы покупателей
August 4, 2025
No reason to yolo this live without a few normal sessions, and Bad settings can ruin the idea.
July 26, 2025
20 percent less clicking is the line to watch. Market checks feel quicker.
Продукты, доступные в cTrader Store, включая торговых ботов, индикаторы и плагины, предоставляются сторонними разработчиками и доступны исключительно в информационных и технических целях. cTrader Store не является брокером и не предоставляет инвестиционные консультации, персональные рекомендации или какие-либо гарантии будущей доходности.


С 08/06/2025
1
Продажи