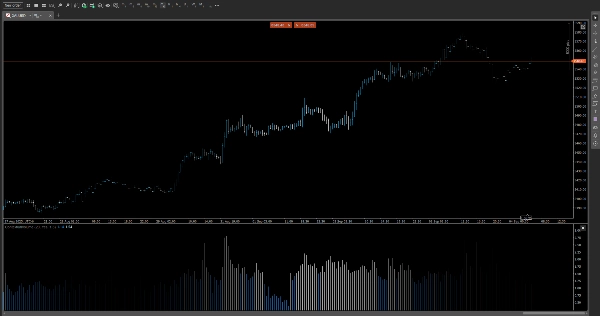
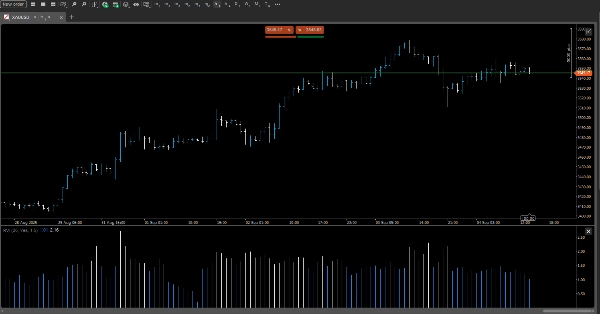
Логотип продукта "RVI"
RVI
Загруженное изображение продукта "RVI"
17
Продажи
1.71K
Бесплатные установки

📊 Relative Volume Intraday (RVI)

Spot the volume surges that matter—when they matter.

RVI is a precision-crafted indicator that compares current volume to its historical average for the same time of day, revealing hidden momentum and liquidity shifts across intraday sessions.


🔍 Key Features

Time-of-Day Volume Profiling

Calculates average volume per time slot (e.g., 10:15 AM) across previous sessions, giving you a contextual benchmark for every candle.

Multi-Timeframe Support

Works seamlessly from 5-minute charts up to 12-hour timeframes, adapting to your trading style—scalping, swing, or session-based.

Dynamic Color Coding

Highlights candles with above-average volume using customizable color thresholds. Instantly spot high activity zones with intuitive visual cues.

Ratio vs. Difference Mode

Choose your preferred metric:

Ratio Mode: Displays current volume ÷ average volume (e.g., 2.3×)

Difference Mode: Shows absolute deviation (e.g., +1,200 contracts)

Overlay or Panel Display

Toggle between inline chart overlays or a compact side panel for clean integration with your existing layout.


🎯 Use Cases

Confirm breakout strength with volume spikes relative to typical activity

Filter false signals during low-volume periods

Identify institutional footprints during key intraday windows

Enhance volume-based strategies with time-aware context


⚙️ Customization Options

Adjustable lookback period for historical averaging

User-defined color thresholds for volume intensity

Toggle display mode (Ratio/Difference)

Compatible with dark/light themes

Профиль индикатора
0.0
Отзывы: 0
Отзывы покупателей
У этого продукта еще нет отзывов. Уже попробовали его? Поделитесь впечатлениями!
Prop
Forex
Breakout
Indices
Commodities
Crypto
Продукты, доступные в cTrader Store, включая торговых ботов, индикаторы и плагины, предоставляются сторонними разработчиками и доступны исключительно в информационных и технических целях. cTrader Store не является брокером и не предоставляет инвестиционные консультации, персональные рекомендации или какие-либо гарантии будущей доходности.

Больше от этого автора

The Indicator is a powerful tool for price-action traders seeking to identify and exploit short-term imbalances.
Логотип продукта "Smooth Heiken Ashi"
5.0
(1)
$ 19
The Smooth Heiken Ashi indicator is a refined charting tool designed to filter out market noise and highlight true price
A powerful overlay tool designed to automatically plot Fibonacci retracement levels based on a custom window.
A precision overlay tool that combines session-aware VWAP logic and standard deviations.
A next‑generation moving average designed to deliver exceptional smoothness with minimal lag.
Логотип продукта "Fractals"
$ 19
/
$29
Fractals is a precision-engineered trading indicator for cTrader that reveals the hidden architecture of price action.
Automatically calculates the previous day’s high and low, determines the range, and then projects Fibonacci levels.
Логотип продукта "MARainbow"
$ 19
/
$38
MARainbow gives you the edge with four customizable moving averages—each color-coded for instant recognition.
An indicator that redefines ATR by applying a percentile-based filter giving traders a grounded view of volatility.
A precision-engineered indicator designed for traders who demand signal integrity across volatile markets.
A precision tool for measuring how efficiently price moves from point A to B.
A trading robot designed for traders who want precision for high-volatility markets (XAUUSD, US500, US100, WTI, others.)

Вам также может понравиться

Логотип продукта "Market Bias Gauge"
4.0
(2)
Бесплатно
Measure Market Strength at a Glance – Instantly
Area of Interest with the power of AI to detect the market interest.
Zero Lag MACD delivers ultra-responsive trend and divergence signals with minimal lag, empowering timely Forex entries.
Market Structure Indicator – Your Trading Map in a Noisy Market. No more Panicking Which one, Where, Why and How.
⏱ Candle Time Remaining – Real-Time Candle Countdown Indicator
The Advanced Crosshair is a tool that helps you visualize better the data on the chart inside your cTrader platform.
Optimize exits with Chandelier Exit! Visualize stop-loss points dynamically for improved trading precision and safety.
Bayesian theory** to forecast a future price while providing **uncertainty ranges** that represent upper and lower bound
Enhance Your Trading Strategy with the Larry Williams 9-5-3 Indicator
Macro Matrix: Sync high-order market flows with your current chart. Decode trend hierarchy and macro structure.
SMC/ICT signals using FVG + liquidity sweep/MSS with EMA-RSI-MACD filters, clear visuals, and actionable alerts.
corrigido todos os bugs e cores invertidas tabajara antigo deleetado
Multi-TF FVG + Smart Fibonacci
A function demo version of VWAP indicator with std. dev. bands. Expired on 1st Aug, 2025.
This indicator is perfect for traders looking to focus on high-probability trading windows.
The FZ indicator draws Fibonacci channel zones based on the highest and lowest prices over a user-defined period.
njkfgtrwevwpkoye
🚀 HAI QUANTUM v4.0 | The Ultimate Quantum Terminal for cTrader (Smart Money & Algorithmic Trading)
17
Продажи
1.71K
Бесплатные установки