
PrevDayProjection
Индикатор
221 скачивания
Версия 1.0, Sep 2025
Windows, Mac
Описание
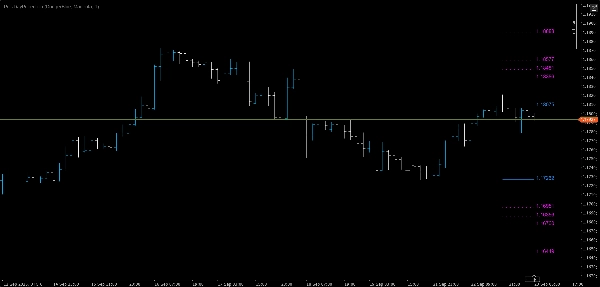
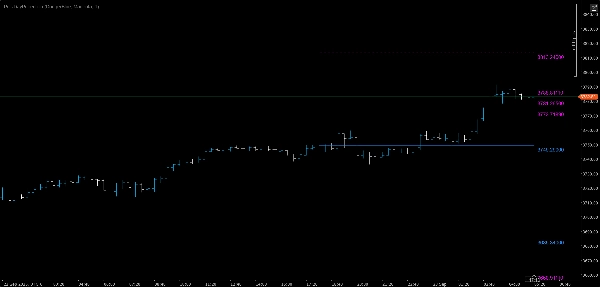
Уровни проекции предыдущего дня
Откройте для себя точную торговлю с динамическими проекциями Фибоначчи на основе ценового движения вчерашнего дня.
Этот индикатор автоматически рассчитывает максимум и минимум предыдущего дня, определяет диапазон, а затем проецирует уровни Фибоначчи как выше, так и ниже этого диапазона — предоставляя вам мгновенные ориентиры для потенциальных зон поддержки, сопротивления и пробоя.
Основные особенности
- 📅 Автоматическое определение максимума и минимума предыдущего дня
- 📏 Проекции Фибоначчи на основе диапазона на уровнях 38,2%, 50%, 61,8% и 100%
- 🔼 Выше предыдущего максимума: четыре уровня Фибоначчи для целей продолжения роста
- 🔽 Ниже предыдущего минимума: четыре уровня Фибоначчи для целей продолжения падения
- 🎯 Линии только на сегменте, начиная с первого бара сегодняшнего дня — без загромождения графика
- 🏷 Ценовые метки на правом краю для быстрого визуального ориентирования
- 🎨 Настраиваемые цвета и толщина линий для соответствия стилю вашего графика
Почему трейдерам это нравится
- Четкая внутридневная карта: точно знайте, где находятся ключевые уровни до начала сессии.
- Анализ в двух направлениях: планируйте как рост, так и падение.
- Экономия времени благодаря автоматизации: не требуется ручное рисование или пересчет.
- Работает на любом таймфрейме: от скальпинга до свинг-трейдинга.
Идеально подходит для
- Дейтрейдеров, ищущих точные цели пробоя
- Свинг-трейдеров, определяющих ключевые зоны отката
- Всех, кто использует уровни Фибоначчи в своей стратегии
💡 Совет: сочетайте этот индикатор с вашими любимыми инструментами импульса или объема для подтверждения входов и выходов около этих проецируемых уровней.
Сводка
ИИ-сводка
PrevDayProjection is a technical indicator designed for trading platforms that automatically calculates the previous trading day’s high and low prices, determines the range, and projects Fibonacci levels based on that range. It generates key Fibonacci retracement and extension levels at 38.2%, 50%, 61.8%, and 100% both above the previous high and below the previous low. These levels serve as potential support, resistance, and breakout zones.
The indicator displays segment-only lines starting from the current day’s first bar to avoid chart clutter and includes price labels at the right edge for quick reference. Users can customize colors and line thickness to fit their chart style. It supports any timeframe, making it suitable for scalping, day trading, and swing trading.
PrevDayProjection is applicable across multiple markets including Forex, Indices, Commodities, and Crypto, with specific tags indicating symbols like EURUSD, XAUUSD (gold), and NAS100. It provides traders with a clear intraday roadmap and dual-direction analysis to plan for both bullish and bearish moves. The tool automates manual calculations, saving time and enhancing precision in identifying breakout targets and retracement zones.
Профиль индикатора
Отзывы покупателей
0.0
Отзывы: 0
Отзывы покупателей
У этого продукта еще нет отзывов. Уже попробовали его? Поделитесь впечатлениями!
Обсуждение
Частые вопросы
Forex
Indices
EURUSD
Commodities
Crypto
XAUUSD
NAS100
Продукты, доступные в cTrader Store, включая торговых ботов, индикаторы и плагины, предоставляются сторонними разработчиками и доступны исключительно в информационных и технических целях. cTrader Store не является брокером и не предоставляет инвестиционные консультации, персональные рекомендации или какие-либо гарантии будущей доходности.


Цена
26
Продажи
2.17K
Бесплатные установки