
Описание
Если вы ищете динамический индикатор канала Фибоначчи для cTrader, вам больше не нужно искать. Этот индикатор автоматически рисует полосы Фибоначчи параллельно выбранной вами скользящей средней. Он удобен в использовании и, как и мои другие индикаторы, предоставляет оповещения через всплывающие окна, звук, электронную почту и сообщения в Telegram. Кроме того, у вас есть возможность настроить полосы, уровни Фибоначчи и оповещения.
Вот список его функций:
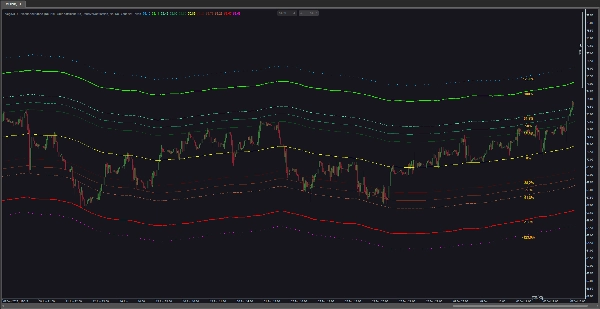
- Расчет полос Фибоначчи: Индикатор рассчитывает и отображает полосы Фибоначчи на основе выбранной вами скользящей средней. Эти полосы исходят из уровней Фибоначчи (например, 0,0%, 38,2%, 61,8% или любых других) и простираются выше и ниже скользящей средней на заданный коэффициент.
- Настройка скользящей средней: Настройте тип скользящей средней (например, простая, экспоненциальная и т.д.) и количество периодов, используемых в расчете. Скользящая средняя служит основой для полос Фибоначчи.
- Функционал оповещений: Индикатор предлагает различные варианты оповещений для уведомления трейдеров о конкретных событиях. Это включает оповещения о касании ценового уровня и оповещения о приближении.
- Оповещения о касании ценового уровня: Настройте индикатор для срабатывания оповещений, когда цена касается определенных уровней Фибоначчи. Оповещения могут основываться на цене закрытия или срабатывать сразу при касании уровня.
- Оповещения о приближении: Настройте оповещения о приближении, чтобы получать уведомления, когда цена подходит к указанному уровню Фибоначчи или отдаляется от него на заданное расстояние. Оповещения могут срабатывать при приближении или удалении цены от уровня.
- Варианты вывода оповещений: Выбирайте из звуковых оповещений, всплывающих окон, сообщений в Telegram и уведомлений по электронной почте. Звуковые оповещения можно настроить, выбрав различные звуковые файлы.
- Варианты визуализации: Настройте отображение уровней Фибоначчи с такими опциями, как показ процентных значений, установка цвета для процентных меток, управление расположением меток на графике, включение/отключение отдельных полос и выбор цвета, толщины и внешнего вида полос.
- Настраиваемые уровни Фибоначчи: Подгоняйте индикатор под вашу торговую стратегию, регулируя конкретные уровни Фибоначчи, используемые в расчете. Положительные и отрицательные уровни Фибоначчи можно настраивать отдельно.
- Встроенное руководство пользователя: Вы можете получить доступ к руководству пользователя для этого индикатора прямо с графика.
В заключение, индикатор VegaXLR - Fibonacci Bands сочетает анализ Фибоначчи и скользящие средние, чтобы помочь определить потенциальные уровни поддержки и сопротивления. С настраиваемыми функциями оповещений и вариантами визуализации это незаменимый инструмент для трейдеров, которые опираются на уровни коррекции или расширения Фибоначчи.
Сводка
It features multiple alert options including price level touch alerts—triggered on price contact or close at specified Fibonacci levels—and proximity alerts that notify when price approaches or moves away from these levels within a defined range. Alerts can be delivered via pop-up, sound (with customizable sounds), email, and Telegram messages.
Visualization settings enable customization of band colors, thickness, label display and position, and selective enabling or disabling of bands. A built-in user guide is accessible directly from the chart for ease of use.
Overall, VegaXLR - Fibonacci Bands combines Fibonacci retracement and expansion analysis with moving averages to assist traders in identifying potential support and resistance zones, enhanced by configurable alerts and visualization options.
Отзывы покупателей
5 | 100 % | |
4 | 0 % | |
3 | 0 % | |
2 | 0 % | |
1 | 0 % |


