
Описание
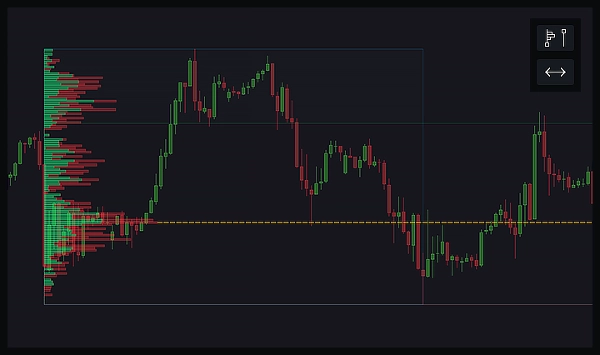
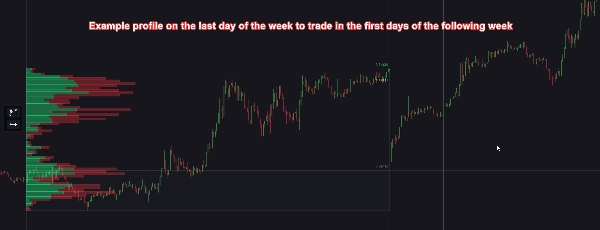
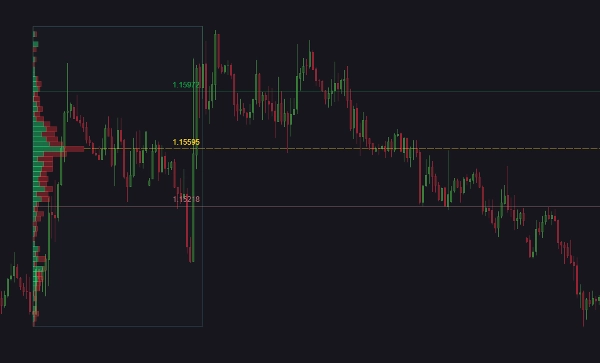
Профиль объема с фиксированным диапазоном — это инструмент, который показывает, сколько торговой активности произошло на разных ценовых уровнях в пределах определенного диапазона на графике. Вы рисуете прямоугольник над интересующей вас областью, и профиль отображает горизонтальные полосы, указывающие объем сделок на каждом ценовом уровне в этом диапазоне. Это помогает увидеть, где происходило наибольшее количество покупок и продаж, выделяя ключевые ценовые уровни, которые могут быть важны для принятия торговых решений.
Ключевые компоненты профиля объема с фиксированным диапазоном включают:
- Точка контроля (POC): Ценовой уровень с наибольшим объемом торгов в выбранном диапазоне. Часто рассматривается как значимый уровень поддержки или сопротивления, поскольку отражает цену, на которой произошло много торговой активности.
- Верхняя граница зоны стоимости (VAH): Верхняя граница ценового диапазона, в котором произошло 70% от общего объема торгов. Цены выше этого уровня считаются менее торгуемыми и потенциально переоценёнными.
- Нижняя граница зоны стоимости (VAL): Нижняя граница ценового диапазона, в котором произошло 70% от общего объема торгов. Цены ниже этого уровня считаются менее торгуемыми и потенциально недооценёнными.
Эти линии помогают трейдерам определить значимые ценовые уровни, которые могут выступать в роли поддержки или сопротивления. Понимая, где сосредоточен основной объем торгов, трейдеры могут принимать более обоснованные решения о возможных движениях цены, точках входа и выхода.
Например, если текущая цена находится рядом с POC, это может указывать на сильный уровень поддержки или сопротивления. Если цена находится в зоне стоимости, это говорит о том, что она находится в диапазоне справедливой стоимости, тогда как цены за пределами зоны стоимости могут рассматриваться как потенциальные точки прорыва или пробоя.
Что делает этот индикатор:
Этот индикатор улучшает ваш торговый график мощным анализом профиля объема и настраиваемыми оповещениями. С помощью двух интуитивно понятных кнопок вы можете легко рисовать профили объема с фиксированным диапазоном и расширять или сужать ключевые уровни до бесконечности. Профиль объема можно визуализировать в двух режимах: общий или с разделением на бары вверх и вниз. Настраивайте количество уровней, разрешение данных (Точное или Быстрое) и размер зоны стоимости в соответствии с вашими потребностями.
Магнитные диапазоны автоматически обновляются на основе последней свечи, обеспечивая актуальность вашего анализа. Вы также можете настроить внешний вид и поведение профиля и его компонентов, включая линии POC, VAH и VAL. Оповещения можно настроить на касание цены, с возможностью запускать действия, такие как запуск или остановка cBot, и закрытие позиций. Оповещения могут приходить через звук, всплывающие окна cTrader, сообщения в Telegram (с опциональными скриншотами) и электронную почту.
Особенности:
- Профиль объема с фиксированным диапазоном: Нарисуйте прямоугольник для визуализации профиля объема выбранного диапазона.
- Расширение/сжатие линий: Расширяйте или сжимайте линии POC, VAH и VAL до бесконечности.
- Режимы профиля объема: Выбирайте между общим объемом или барами вверх и вниз.
- Настраиваемые уровни и разрешение: Выбирайте количество уровней и разрешение (Точное или Быстрое).
- Регулируемая зона стоимости: Устанавливайте размер зоны стоимости.
- Магнитные диапазоны: Автоматически изменяют размер диапазонов в соответствии с последней свечой, обновляются каждые 1–10 минут или при закрытии бара.
- Настраиваемый внешний вид: Изменяйте положение, размер и стиль кнопок, линий и полос объема.
- Оповещения о касании цены: Получайте уведомления при касании цены линий POC, VAH или VAL.
- Интеграция с cBot: Запускайте или останавливайте cBot на основе оповещений.
- Управление позициями: Закрывайте позиции при срабатывании оповещений с настраиваемыми опциями для каждой линии (POC, VAH и VAL).
- Методы оповещений: Получайте оповещения через звук, всплывающие окна cTrader, сообщения в Telegram (с опциональными скриншотами) и электронную почту.
- Оптимизация производительности: Возможность автоматически удалять прошлые диапазоны, не видимые на графике, для улучшения производительности.
- Глобальное управление оповещениями: Легко включайте или отключайте все оповещения этого индикатора.
- Руководство пользователя: Вы можете легко открыть руководство пользователя этого индикатора через небольшую кнопку на графике.
Сводка
The indicator offers two visualization modes: total volume or separate up and down volume bars. It features customizable settings for the number of volume levels, data resolution (Precise or Fast), and value area size. Magnetic ranges automatically update based on the latest candle to keep analysis current. Users can expand or contract POC, VAH, and VAL lines infinitely.
Alerts can be configured for price touches on these key levels, with notifications via sound, platform pop-ups, Telegram (including optional screenshots), and email. Alerts can trigger actions such as starting/stopping cBots or closing positions. The indicator also supports customizable appearance, performance optimization by auto-deleting out-of-view ranges, and global alert control. A user guide is accessible directly from the chart interface.
Отзывы покупателей
5 | 67 % | |
4 | 0 % | |
3 | 33 % | |
2 | 0 % | |
1 | 0 % |


