
VegaXLR - cTrader Chart Themes
Индикатор
336 скачивания
Версия 1.1, Nov 2025
Windows, Mac
5.0
Отзывы: 3
Описание
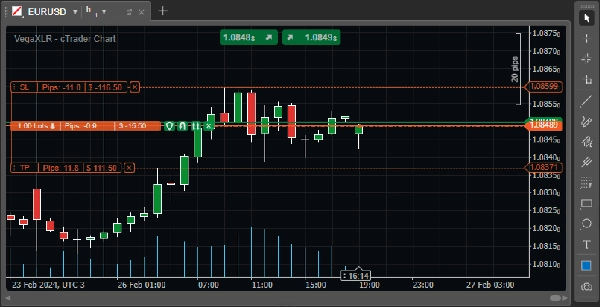
Это бесплатный набор тем оформления графиков cTrader. Эти темы не изменят настройки ваших шаблонов графиков, они только изменят цвета графика.
Как применить:
- Установите файл как любой другой индикатор — просто дважды щелкните по нему.
- Добавьте индикатор на ваш график.
- Выберите предпочитаемую тему.
- Когда тема вас устроит, удалите индикатор с графика.
- Сохраните тему как шаблон графика. Готово!
Ищете больше инструментов для cTrader? Ознакомьтесь с разделом «Больше от этого автора» ниже. Там вы найдете разнообразные индикаторы и cBots, включая оповещения по скользящим средним, профиль объема с фиксированным диапазоном, оповещения по трендовым линиям и многое другое!
Сводка
ИИ-сводка
VegaXLR - cTrader Chart Themes is a free pack of customizable chart color themes designed for the cTrader trading platform. The product allows users to change the visual color scheme of their charts without altering any existing chart template configurations. Installation involves adding the indicator to a chart, selecting a preferred theme, then removing the indicator and saving the theme as a chart template. This tool supports various market types including Forex, Indices, Commodities, Crypto, and Stocks, providing a straightforward way to personalize chart appearance across these markets on cTrader.
Профиль индикатора
Отзывы покупателей
5.0
Отзывы: 3
5 | 100 % | |
4 | 0 % | |
3 | 0 % | |
2 | 0 % | |
1 | 0 % |
Отзывы покупателей
March 31, 2026
September 18, 2025
Обсуждение
Частые вопросы
Prop
Forex
Indices
Commodities
Crypto
Stocks
Продукты, доступные в cTrader Store, включая торговых ботов, индикаторы и плагины, предоставляются сторонними разработчиками и доступны исключительно в информационных и технических целях. cTrader Store не является брокером и не предоставляет инвестиционные консультации, персональные рекомендации или какие-либо гарантии будущей доходности.


Цена
231
Продажи
692
Бесплатные установки