
Описание
Революционизируйте свою торговлю с помощью лучшего индикатора графических моделей cTrader
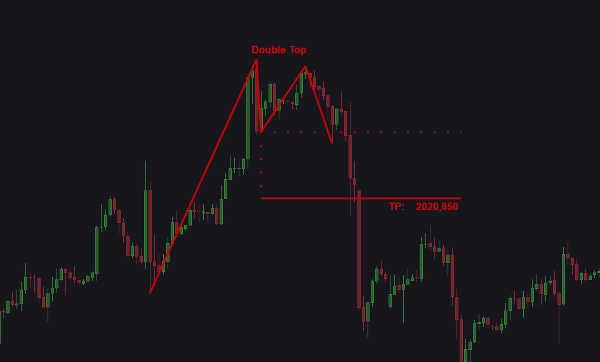
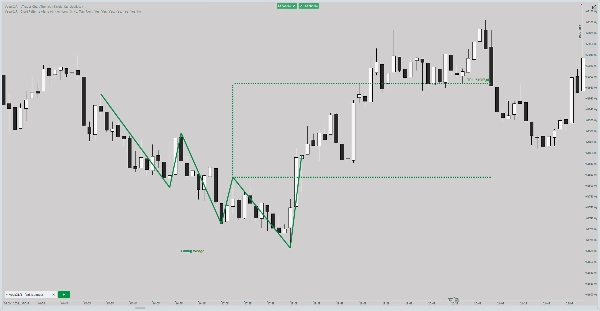
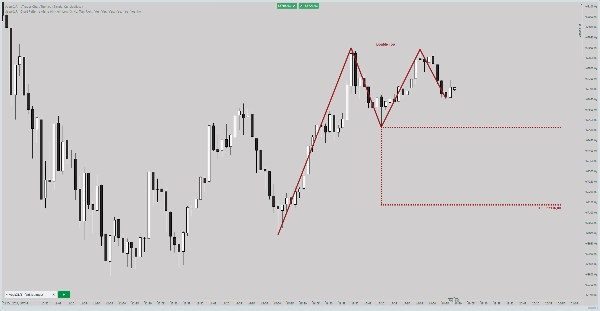
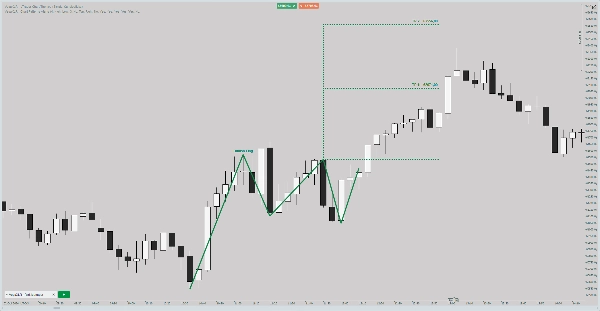
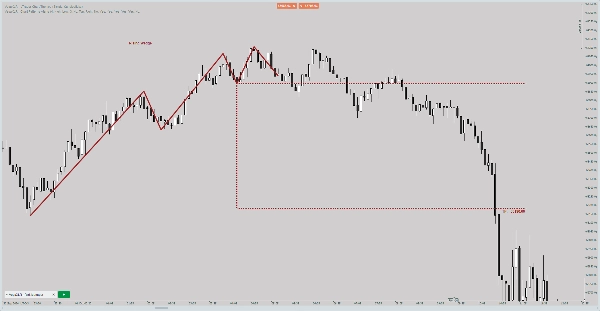
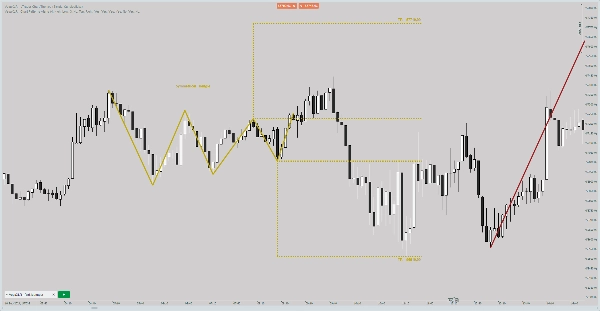
Поднимите свою торговую стратегию на новый уровень с этим передовым индикатором cTrader, профессионально разработанным для обнаружения и выделения критически важных графических моделей для точного анализа рынка. Этот продвинутый инструмент выявляет ключевые модели, такие как Двойные вершины, Голова и плечи, Восходящие треугольники и другие, предоставляя трейдерам мощное преимущество в форекс, торговле на фондовом рынке и во всех рынках, представленных на платформе cTrader.
Основные функции:
- Автоматическое обнаружение графических моделей: мгновенно выявляйте такие модели, как бычьи флаги, симметричные треугольники и восходящие клинья.
- Построение колебаний модели: легко визуализируйте линии шеи, целевые линии и движения цены.
- Настраиваемые оповещения: оставайтесь в курсе с помощью оповещений через звук, всплывающие окна, Telegram или электронную почту — адаптированные под ваши потребности.
- Цветовая кодировка: быстро различайте бычьи, медвежьи и нейтральные модели с помощью настраиваемых цветовых схем.
- Список моделей с статистикой: легко отслеживайте появление моделей с помощью встроенного списка с аббревиатурами и подсчетом.
- Регулируемые уровни масштабирования: сосредоточьтесь на определенных размерах моделей для детального анализа.
- Отображение потенциальной прибыли: оценивайте потенциальные торговые возможности с четкими указаниями размера прибыли.
- Ясность таймфрейма и символа: оповещения включают точные данные о символе и таймфрейме для обоснованного принятия решений.
- Опция приостановки оповещений: анализируйте модели без отвлечений, приостанавливая уведомления.
- Функция заметок пользователя: добавляйте комментарии для уточнения стратегии или заметки по конкретным моделям.
Обнаруженные графические модели:
- Двойная вершина
- Двойное дно
- Голова и плечи
- Перевернутая голова и плечи
- Симметричный треугольник
- Восходящий треугольник
- Нисходящий треугольник
- Бычий флаг
- Медвежий флаг
- Восходящий клин
- Нисходящий клин
Этот интуитивно понятный торговый индикатор дает трейдерам возможность, сочетая автоматическое обнаружение графических моделей, настраиваемые оповещения и визуализацию в реальном времени. Независимо от того, торгуете ли вы на рынке форекс, анализируете фондовые графики или исследуете пользовательские индикаторы cTrader, этот инструмент предоставляет необходимые данные для принятия более умных и уверенных решений. Идеально подходит для трейдеров, стремящихся овладеть техническим анализом и оптимизировать свои стратегии управления рисками.
Откройте свой торговый потенциал уже сегодня с этим комплексным индикатором cTrader!
Предупреждение:
Этот индикатор является инструментом технического анализа, предназначенным для помощи трейдерам путем предоставления данных и визуализаций на основе графических моделей и рыночных данных. Он не является самостоятельным торговым решением и не гарантирует прибыльных результатов. Пользователи должны применять собственные торговые стратегии, управление рисками и процессы принятия решений при использовании этого продукта. Прошлые результаты не являются гарантией будущих. Торговля на финансовых рынках связана с высоким риском, и вы должны торговать только тем капиталом, который можете позволить себе потерять.
Сводка
Key functionalities include automatic pattern detection, real-time visualization of pattern components like necklines and target lines, and customizable alerts delivered via sound, pop-up, Telegram, or email. It features color-coded insights to distinguish bullish, bearish, and neutral patterns, a pattern list with occurrence statistics, adjustable zoom levels for detailed analysis, and profit potential display to evaluate trade opportunities. Alerts provide clear symbol and timeframe information, and users can pause notifications or add personal notes for strategy refinement.
This tool assists traders in technical analysis and risk management by providing actionable insights based on chart patterns. It is intended as a supportive tool and does not function as a standalone trading solution. Users must apply their own trading strategies and risk controls when using this indicator.
Отзывы покупателей
5 | 67 % | |
4 | 0 % | |
3 | 33 % | |
2 | 0 % | |
1 | 0 % |


![Логотип продукта "[Stellar Strategies] Smart ADX"](https://cdn.ctrader.com/image/webp/af13b084-b6f6-41db-b7bc-c7e688b57b05_36929)


