

OrderFlow Absorption Matrix
Индикатор
1 покупки
Версия 1.0, Jul 2026
Windows, Mac
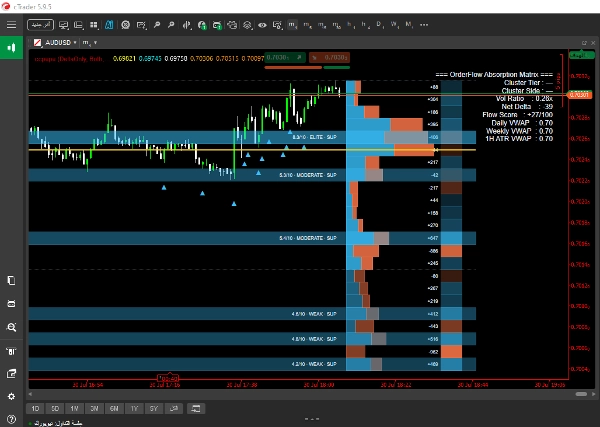
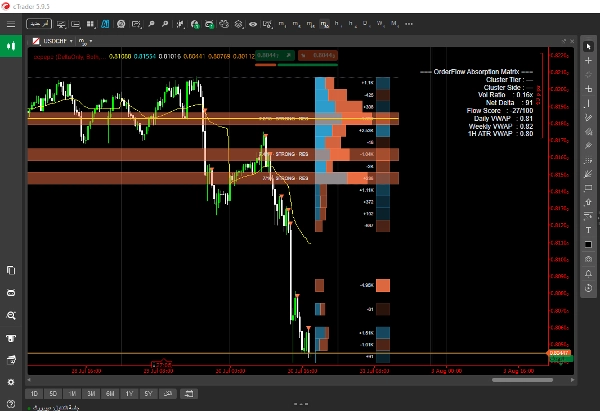
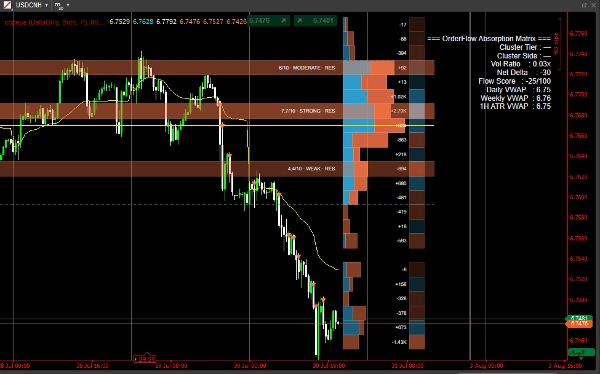
С 23/06/2025
1
Продажи
Описание
1️⃣ Обнаружение потока заказов и дельты
- Детализация на более низком таймфрейме (LTF): Индикатор анализирует данные свечей более низкого таймфрейма (например, 1-минутные бары) внутри каждого текущего бара для вычисления:
-
- Чистая дельта: Чистая разница между объемом покупок и продаж.
- Поглощение: Большой объем, торгуемый на экстремумах бара, который не способен продвинуть цену дальше, сигнализируя о крупных пассивных лимитных ордерах, поглощающих ликвидность рынка.
- Обнаружение следов китов: Использует динамические Процентилы, рассчитанные по трем различным окнам обзора (Короткое, Среднее, Длинное), в сочетании с настраиваемым Консенсусным движком для выделения настоящих институциональных всплесков объема.
2️⃣ Адаптивный движок объемного профиля
- Сегментация по бинам: Делит исторический ценовой диапазон (Lookback Bars) на равные вертикальные ценовые бины.
- Распределение объема: Разделяет объем покупок, объем продаж и дельту по каждому бину, отображая пропорциональные горизонтальные профильные бары справа от графика.
- Динамическая обработка таймфреймов: Вместо использования фиксированных секундных тиков индикатор динамически оценивает реальные интервалы баров (
GetCurrentBarSpan). Это предотвращает схлопывание профиля или искажение линий при нестандартных таймфреймах и перерывах торговых сессий (например, ночные гэпы фондового рынка). - Расчет зоны стоимости и POC:
-
- POC (Точка контроля): Определяет ценовой уровень с наибольшим объемом и выделяет его заметной опорной линией.
- Зона стоимости (VA): Динамически выделяет основной процент объема (например, 70%) и рисует Верхнюю границу зоны стоимости (VAH) и Нижнюю границу зоны стоимости (VAL).
3️⃣ Взвешенная многофакторная система оценки зон
Каждый ценовой бин непрерывно оценивается с использованием взвешенной многофакторной формулы с оценкой от 1 до 10:
Score=w1⋅Volume+w2⋅Absorption+w3⋅Touches+w4⋅Rejections+w5⋅Recency
- Автоматический профилинг зон: Уровни с высокой оценкой (Элитные или Сильные) проецируются на график как динамические зоны поддержки/сопротивления с числовыми значками силы в реальном времени.
4️⃣ Сигналы Anchored VWAP и триггеры исполнения
- Вычисляет эталонные линии VWAP, закрепленные за ключевыми временными сдвигами (начало дня, недели и месяца).
- Перекрестный анализ ценового действия относительно закрепленных VWAP вместе с высокообъемными Триггерами кластеров для нанесения точных стрелок входа прямо на график.
5️⃣ Аналитическая панель на экране
Чистый HUD в реальном времени, расположенный в любом углу графика по вашему выбору, предоставляет мгновенное резюме рыночных условий:
- Уровень кластера: Классификация текущего бара (Кит, Средний, Малый).
- Сторона кластера и чистая дельта: Направленное смещение ликвидности и точные числовые значения дельты.
- Коэффициент объема: Текущий объем относительно скользящих средних.
- Оценка потока: Нормализованная оценка импульса/потока ордеров в диапазоне от −100 до +100.
- Эталонные уровни VWAP: Значения в реальном времени для активных уровней VWAP
Сводка
ИИ-сводка
OrderFlow Absorption Matrix is an advanced indicator for cTrader that provides detailed order flow and volume profiling to identify institutional trading activity. It analyzes lower timeframe candle data to calculate net delta (buy vs. sell volume) and absorption, highlighting heavy volume at bar extremes where price fails to move further, indicating large passive limit orders. The indicator detects significant volume spikes ("Whale Prints") using dynamic percentiles across multiple lookback windows combined with a consensus engine.
It features an adaptive volume profile engine that segments historical price ranges into equal bins, displaying buy volume, sell volume, and delta per bin with proportional horizontal bars. The profile dynamically adjusts for varying timeframes and market session breaks, calculating key levels such as Point of Control (highest volume price) and Value Area (core volume range).
A weighted multi-factor scoring system continuously evaluates price bins based on volume, absorption, touches, rejections, and recency, projecting high-scoring zones as dynamic support/resistance levels with numeric strength indicators. Anchored VWAP lines are calculated for key time anchors (day, week, month) and combined with volume cluster triggers to plot precise entry signals.
An on-screen analytics dashboard provides real-time summaries including cluster tier classification, directional delta, volume ratios, momentum scores, and VWAP benchmarks, aiding in market condition assessment and trade decision-making.
It features an adaptive volume profile engine that segments historical price ranges into equal bins, displaying buy volume, sell volume, and delta per bin with proportional horizontal bars. The profile dynamically adjusts for varying timeframes and market session breaks, calculating key levels such as Point of Control (highest volume price) and Value Area (core volume range).
A weighted multi-factor scoring system continuously evaluates price bins based on volume, absorption, touches, rejections, and recency, projecting high-scoring zones as dynamic support/resistance levels with numeric strength indicators. Anchored VWAP lines are calculated for key time anchors (day, week, month) and combined with volume cluster triggers to plot precise entry signals.
An on-screen analytics dashboard provides real-time summaries including cluster tier classification, directional delta, volume ratios, momentum scores, and VWAP benchmarks, aiding in market condition assessment and trade decision-making.
Профиль индикатора
Категория индикатора
Статистика
Тип вывода
Фильтр
Требования к данным
Тиковые данные
Поддерживаемые сигналы
Прорыв уровня
Касание уровня
Разворот
Расхождение
Обсуждение
Отзывы покупателей
0.0
Отзывы: 0
Отзывы покупателей
У этого продукта еще нет отзывов. Уже попробовали его? Поделитесь впечатлениями!
Частые вопросы
Bollinger Bands
Key Levels
Volume
Supply & Demand
VWAP
Support & Resistance
Продукты, доступные в cTrader Store, включая торговых ботов, индикаторы и плагины, предоставляются сторонними разработчиками и доступны исключительно в информационных и технических целях. cTrader Store не является брокером и не предоставляет инвестиционные консультации, персональные рекомендации или какие-либо гарантии будущей доходности.
Больше от этого автора















![Логотип продукта "Session Volume Profile (SVP) [Iridio Capital]"](https://cdn.ctrader.com/image/webp/b058beb7-b143-45f3-87d0-8c524c00b203_61552)
![Логотип продукта "Smart Money Concepts (SMC) [Iridio Capital]"](https://cdn.ctrader.com/image/webp/b4b5414d-a5ca-44b7-a947-e28eca44a218_61548)

Цена
С 23/06/2025
1
Продажи