
Описание
🏆 Более 10 000 трейдеров доверяют нашему набору из 25+ алгоритмов! 🏆
От структуры рынка и ликвидности до умных систем выхода и предиктивных инструментов - мы создали ВСЕ инструменты, необходимые для стабильной работы.
👉 Доступ ко всем 25+ ПРОВЕРЕННЫМ системам:
_______________________________________________
📌 Индикаторы структуры рынка
· ✅ AdvancedMarket Structure: Bos, Choch, SwinLevels, Order Blocks, Market Structure& Liquidity Finder
· 🔄 Динамический анализ структуры рынка поворотных точек
· 🧱 Order Block
· ⚖️ Дисбаланс рынка
· ⛓️ BOS & CHOCH
· 🧠 ICT Power of 3
_______________________________________________
🔚 Умные системы выхода
_______________________________________________
📐 Индикаторы ZigZag
· 🔍 Проекция ликвидности цены ZigZag
· ➖ ZigZag
· 🎯 Трекер экстремумов Zig-Zag
_______________________________________________
🧱 Индикаторы поддержки и сопротивления
· 🟩 SmartTrend линии поддержки и сопротивления
· 🧱 Все уровни поддержки и сопротивления
_______________________________________________
📊 Индикаторы тренда и каналов
· 🔄 Авто-тренд канал
· 📊 Супертренд
· 🌈 Динамический градиент тренда
· 🔁 Реактивная скользящая средняя
_______________________________________________
💧 Инструменты объема и ликвидности
· 📉 Карта ликвидации с кредитным плечом
· 🔍 Разрыв справедливой стоимости Momentum
· 🕒 Сессии разрыва справедливой стоимости
_______________________________________________
⚡ Индикаторы Momentum и RSI
· 🚀 Динамический диапазон Momentum
· 🔎 Многоуровневый трекер свечного смещения
Tracker
_______________________________________________
🔮 Инструменты прогнозирования и проекции
· 📐 Прогноз на основе линейной регрессии и ATR
· 📏 Фибоначчи линейная регрессия мультивременной рамки
· 📈 Проектор рыночного потока с поддержкой объема_________________________
_________________________________________________________________________________________________
_________________________________________________________________________________________________
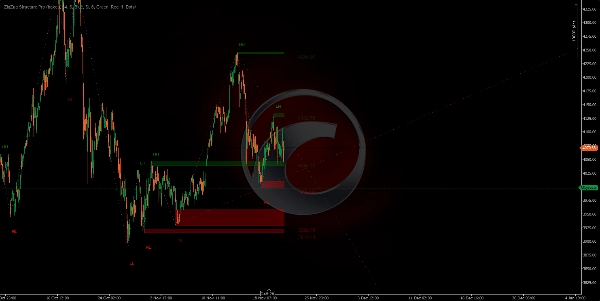
ZigZag Structure Pro – 🚀
Автоматически определяет значимые поворотные точки рынка (ключевые максимумы и минимумы) и рисует динамические зоны поддержки и сопротивления, обновляющиеся в реальном времени. 🎯 В отличие от традиционных статичных уровней, этот индикатор постоянно адаптируется к изменяющейся структуре цены.
Для чего это нужно? ❓
Этот индикатор — профессиональный инструмент технического анализа, предназначенный для:
- Определения институциональных уровней: 🏛️ Автоматически обнаруживает точки, где цена сформировала важные структуры максимумов и минимумов.
- Анализа структуры рынка: 📊 Классифицирует каждое движение согласно методологии бычьей/медвежьей структуры (Higher Highs, Lower Lows и т.д.).
- Прогнозирования тренда: 🔮 Продлевает трендовые линии в будущее для предсказания потенциальных зон реакции цены.
- Торговли разворотами и продолжениями: 💰 Отмеченные уровни служат ориентиром для входов, стоп-лоссов и целей по прибыли.
Индикатор рисует на вашем графике: ✍️
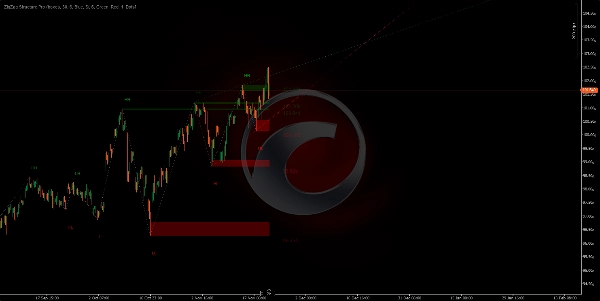
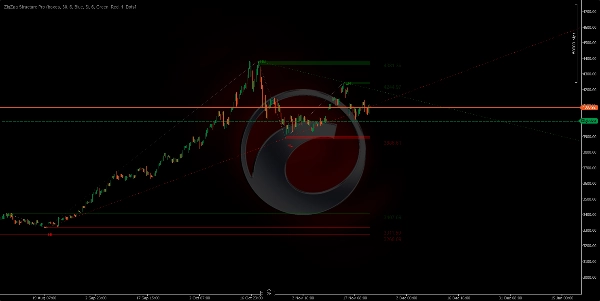
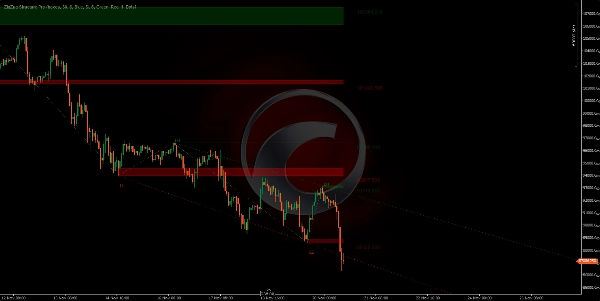
1. Зоны поддержки/сопротивления (прямоугольники)
- Зеленые зоны: 🟢 Отмечают области поддержки (значимые минимумы, где цена может отскочить).
- Красные зоны: 🔴 Отмечают области сопротивления (значимые максимумы, где цена может откатиться).
- Эти зоны проецируются вперед, показывая текущие активные уровни.
- Толщина каждой зоны представляет собой тело свечи, на которой сформировался поворот.
https://chartshots.spotware.com/c/691f5a4d75ac4
https://chartshots.spotware.com/c/691f6b4f2e98b
https://chartshots.spotware.com/c/691f6c6fda808
https://chartshots.spotware.com/c/691f6d0aa6155
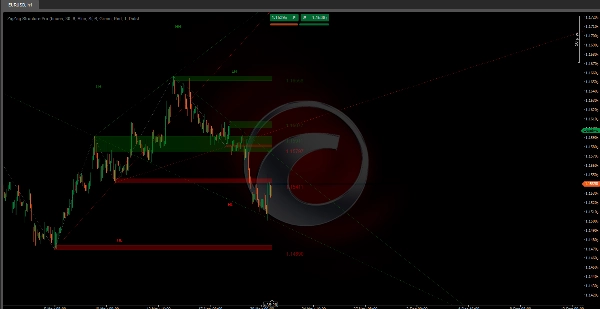
2. Линии соединения ⚡
- Соединяют каждый поворот с следующим, создавая визуальный "зигзаг".
- Устраняют рыночный шум, показывая только действительно значимые движения.
- Облегчают визуальное восприятие направления и структуры тренда с первого взгляда.
3. Проецируемые трендовые линии (расширенные зеленые/красные)
- Рисуются от предыдущего поворота к текущему и продлеваются в будущее.
- Зеленые: 🟢 Линии бычьего тренда (от минимумов).
- Красные: 🔴 Линии медвежьего тренда (от максимумов).
- Показывают 2 самых последних и активных трендовых линии.
- Полезны для обнаружения пробоев или отскоков тренда.
4. Метки структуры рынка 🏷️
Каждый поворот показывает метку, указывающую его классификацию:
- HH (Higher High): ↗️ Более высокий максимум - продолжение бычьего тренда.
- LH (Lower High): ⬆️ Более низкий максимум - возможный медвежий разворот.
- HL (Higher Low): ⬇️ Более высокий минимум - возможный бычий разворот.
- LL (Lower Low): ↘️ Более низкий минимум - продолжение медвежьего тренда.
Логика алгоритма 🧠
Индикатор использует адаптивный алгоритм зигзага, который:
- Сканирует цену в поисках максимумов и минимумов в настраиваемом периоде (по умолчанию 34 бара).
- Фильтрует незначительные движения через порог минимального отклонения (по умолчанию 6 пунктов).
- Проверяет каждый поворот обеспечивая, что он представляет реальное изменение структуры рынка.
- Сравнивает структуры между последовательными поворотами для классификации типа движения.
- Динамически обновляет зоны по мере появления новых поворотов, удаляя самые старые.
Основные настройки ⚙️
- Количество баров для поиска поворотов: Контролирует чувствительность детектора поворотов (меньше = больше поворотов, больше = только крупные повороты).
- Фильтр отклонения цены: Фильтр шума - игнорируются движения меньше этого значения.
- Максимальное количество видимых зон: Количество исторических уровней, остающихся видимыми (от 1 до 20).
- Тип отображения зон: Выбор между прямоугольниками (полные зоны) или простыми линиями.
- Показывать расширенные трендовые линии: Включить/выключить проекции трендов.
Краткое руководство по параметрам 📖
Количество баров для поиска поворотов (По умолчанию: 30)
- ↑ Увеличение (40-100): МЕНЬШЕ поворотов, более важные. Для свинг-трейдинга.
- ↓ Уменьшение (15-25): БОЛЬШЕ поворотов, больше сигналов. Для скальпинга/дейтрейдинга.
Фильтр отклонения цены (По умолчанию: 6)
- ↑ Увеличение (8-15): Фильтрует шум, только крупные движения. Меньше сигналов, выше качество.
- ↓ Уменьшение (2-5): Более чувствительный, захватывает мелкие движения. Больше сигналов.
Максимальное количество видимых зон (По умолчанию: 6)
- ↑ Увеличение (10-20): Больше видимых исторических уровней. Для глубокого анализа.
- ↓ Уменьшение (2-4): Только последние уровни. Чистый график.
Лимит исторических поворотов (По умолчанию: 200)
- ↑ Увеличение (300-500): Больше истории для расчетов. Долгосрочный анализ.
- ↓ Уменьшение (50-150): Только недавняя структура. Лучшая производительность.
Количество активных проекций (По умолчанию: 5)
- ↑ Увеличение (5-10): Больше проецируемых трендовых линий.
- ↓ Уменьшение (1-2): Только доминирующие тренды. Больше ясности.
Показывать расширенные трендовые линии (Да/Нет)
- Включено: Проецирует тренды в будущее.
- Отключено: Только исторический зигзаг.
🎯 Быстрые настройки
- Скальпинг: Lookback 15-20 | Deviation 3-5 | Zones 3-4
- Дейтрейдинг: Lookback 25-35 | Deviation 6-8 | Zones 5-6
- Свинг-трейдинг: Lookback 40-60 | Deviation 10-15 | Zones 8-12
Сводка
Отзывы покупателей
5 | 0 % | |
4 | 100 % | |
3 | 0 % | |
2 | 0 % | |
1 | 0 % |


