
Açıklama
Genel Bakış
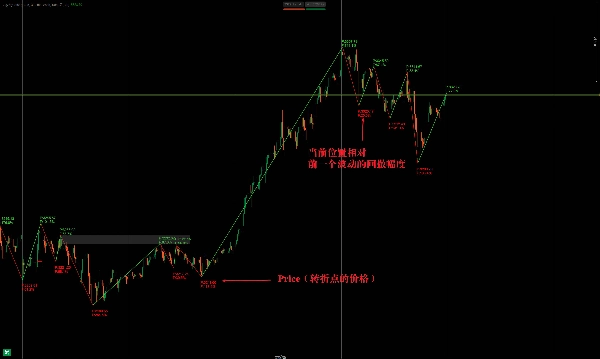
ZigZag göstergesi, piyasa gürültüsünü filtreleyerek öncelikle ana fiyat dönüş noktalarını belirlemek için kullanılan teknik analiz aracıdır. Önemli yüksek ve düşükleri ZigZag çizgileriyle bağlayarak, yatırımcıların trendleri ve potansiyel kırılmaları görselleştirmesine yardımcı olur.
ZigZag Nasıl Çalışır
- Temel İşlev
-
- Bir minimum fiyat değişikliği eşiği (yüzde veya sabit değer) belirleyerek küçük fiyat dalgalanmalarını ortadan kaldırır.
- Yalnızca anlamlı salınım yüksek/düşüklerini bağlar, böylece trend analizini basitleştirir.
- Genellikle destek/direnç seviyeleri, dönüşler (örneğin, baş ve omuzlar, çift tepeler/dipler) tespit etmek için kullanılır.
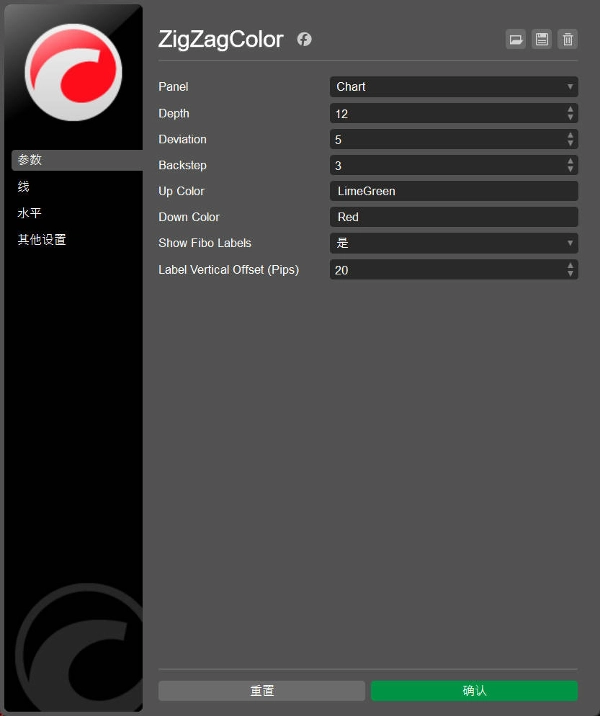
- Ana Parametreler
-
- Minimum Fiyat Hareketi (%): Hassasiyeti belirler (örneğin, %5 bu değerden küçük hareketleri yok sayar).
- Geriye Dönük Derinlik: Kaç geçmiş mumun analiz edildiğini kontrol eder, gecikmeyi etkiler.
Birincil Uygulamalar
1. Trend Tanımlama
- Yükselen Trendler: Daha yüksek yüksekler (HH) + daha yüksek düşükler (HL).
- Düşen Trendler: Daha düşük yüksekler (LH) + daha düşük düşükler (LL).
- Potansiyel kırılma işlemleri için trend çizgileri çizilmesine yardımcı olur.
2. Formasyon Tanıma
- Salınım noktalarını tanımlayarak klasik grafik formasyonlarını (üçgenler, bayraklar, kama) ortaya çıkarır.
3. Fibonacci Düzeltme Seviyeleri
- Fibonacci uzantıları veya düzeltmeleri için net salınım yüksek/düşüklerini işaretler.
4. Uyumsuzluk Tespiti
- Fiyat ile osilatörler (RSI, MACD) arasındaki uyumsuzlukları vurgular.
ZigZag göstergesi, teknik analizde kullanılan bir araçtır ve fiyat trendlerindeki önemli dönüş noktalarını tanımlamak için kullanılır. Bu araç, yatırımcıların piyasa gürültüsünü filtrelemesine ve önemli yüksek ve düşük noktaları vurgulamasına yardımcı olur. İşte temel noktaları ve kullanımı:
ZigZag göstergesinin prensibi
- Temel Fonksiyon:
-
- Fiyat dalgalanması eşiği (yüzde veya sabit değer) belirleyerek küçük dalgalanmaları otomatik olarak yok sayar, yalnızca belirgin yüksek ve düşük noktaları ZigZag şeklinde bağlar.
- Destek/direnç seviyelerinin, trend dönüşlerinin (örneğin baş omuz, çift dip gibi formasyonlar) tanımlanmasına yardımcı olmak için sıkça kullanılır.
- Ana Parametreler:
-
- Minimum Dalgalanma Miktarı (örneğin %5 veya puan): Küçük dalgalanmaların filtrelenme hassasiyetini belirler. Değer ne kadar büyükse, sinyal o kadar az ama daha güvenilirdir.
- Geriye Dönük Derinlik: Hesaplama sırasında referans alınan mum sayısını kontrol eder, dönüş noktalarının gecikmesini etkiler.
Başlıca Kullanım Alanları
- Trend Tanımlama:
-
- Sürekli yükselen yüksekler (yükselen trend) veya düşen düşükler (düşen trend) ile trend yönü belirlenir.
- Trend çizgileri ile birleştirildiğinde, kırılma veya geri çekilme önceden tahmin edilebilir.
- Formasyon Analizi:
-
- Klasik fiyat formasyonlarını (örneğin üçgen, bayrak) tanır, ZigZag çizgileri formasyon sınırlarını net gösterir.
- Fibonacci Araçlarıyla Kullanım:
-
- ZigZag ile işaretlenen dalga yüksek/düşük noktaları, Fibonacci geri çekilme veya genişletme başlangıç/bitiş noktası olarak kullanılır.
- Uyumsuzluk Tespiti:
-
- Fiyat ile göstergeler (örneğin RSI, MACD) arasında uyumsuzluk olduğunda, ZigZag uyumsuzluk bölgesinin başlangıç ve bitiş noktalarını belirlemeye yardımcı olur.


