
MACD Custom MTF (Multiple Time Frame) v1.1 — это продвинутый инструмент, который объединяет проверенную мощь классического MACD с критическим преимуществом многофреймового анализа и современной, интуитивной визуализацией. Разработан для требовательных трейдеров, которые ценят точность, быструю интерпретацию и возможность адаптировать инструменты под свою уникальную стратегию.
Что нового в версии 1.1:
- 100% плавная визуализация: Исправлены разрывы/прерывистость линий MACD – линии теперь идеально непрерывны при смене тренда.
- Лучшая видимость: Увеличен размер точек сигналов Покупки/Продажи, утолщены Сигнальная линия и Гистограмма для кристально четкого отображения. Обесцвечена нулевая линия для снижения нагрузки на глаза.
- Умные и упрощённые оповещения: Упрощено окно настроек. Просто включите "Buy Alert" или "Sell Alert", и индикатор автоматически управляет всплывающими окнами и корректными звуковыми уведомлениями.
- Организованные настройки: Все параметры теперь красиво сгруппированы по интуитивно понятным категориям для гораздо лучшего пользовательского опыта.
- Полная локализация на английский: Все сообщения журнала, всплывающие окна и ошибки полностью локализованы на английский язык.
Многофреймовый (MTF) анализ на одном графике:
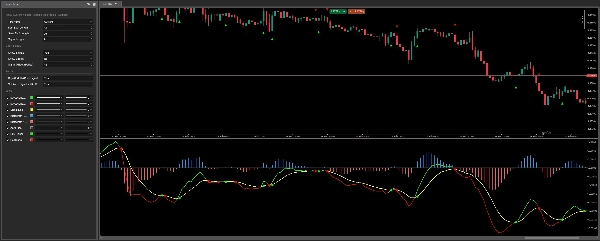
Хватит переключаться между графиками! Отображайте данные MACD с более высокого таймфрейма (например, H1, H4, D1) прямо на вашем текущем рабочем графике (например, M5, M15). Получайте бесценный широкий контекст рынка, выявляйте доминирующие базовые тренды и эффективно фильтруйте вводящий в заблуждение шум с более низких таймфреймов. Полностью настраиваемый – выбирайте из обширного списка таймфреймов, от минутных до месячных.
Динамическое окрашивание MACD и сигнальной линии:
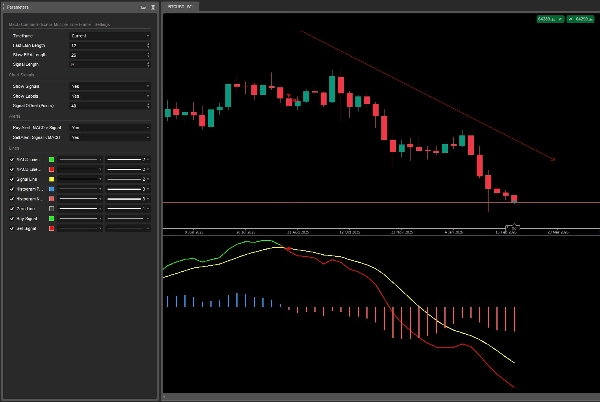
Мгновенное подтверждение тренда: линия MACD динамически меняет цвет при пересечении своей сигнальной линии, ярко показывая бычий или медвежий импульс. Больше никаких догадок – цвет линии сразу показывает, находится ли MACD выше (бычий) или ниже (медвежий) своей сигнальной линии.
Кристально четкая гистограмма:
Легко визуализируйте расхождение (силу) между MACD и его сигнальной линией. Индикатор интуитивно окрашивает утолщённые бары в зависимости от того, положительные они (синие) или отрицательные (красные), обеспечивая глубокое понимание сдвигов импульса с первого взгляда.
Несомненные визуальные сигналы пересечения:
Больше не пропускайте критические пересечения! Индикатор автоматически выделяет пересечения линий MACD/Сигнала. Он отображает четкие, хорошо заметные точки прямо на вашем ценовом графике (с регулируемым смещением) и предлагает опциональные текстовые метки "Buy"/"Sell" для максимальной ясности.
Встроенные умные оповещения:
Встроенные, удобные всплывающие окна и звуковые уведомления для сигналов Покупки и Продажи. Будьте в курсе каждой возможности, не привязываясь к экрану! Просто включите оповещения в настройках и позвольте индикатору следить за вами.
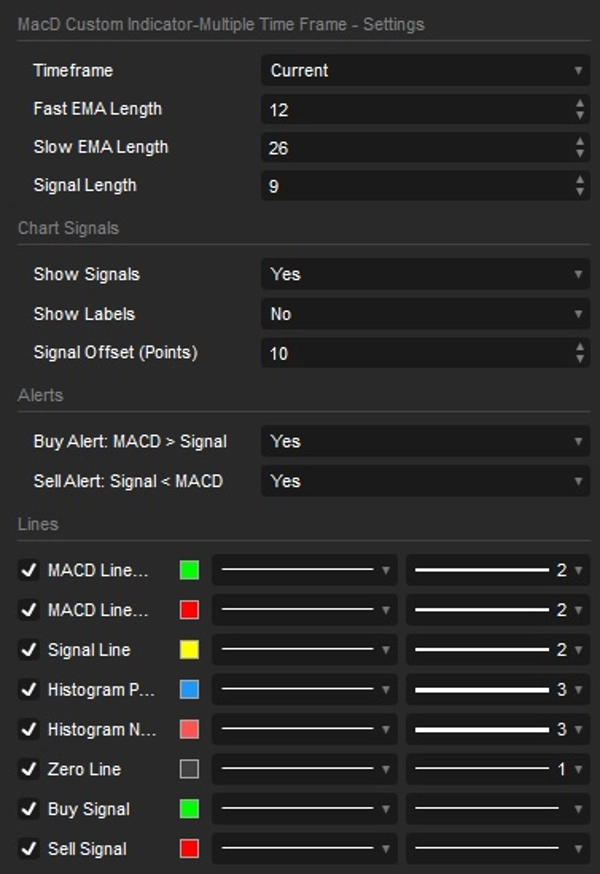
Полная настройка под ваши нужды:
- Настраивайте длины Быстрого EMA, Медленного EMA и сигнальной линии по вашим точным требованиям.
- Все настройки аккуратно организованы в логические группы (Настройки MACD, Сигналы графика, Оповещения) для быстрого изменения.
- Переключайте видимость отдельных визуальных элементов: линии MACD и сигнала, гистограмма, сигналы пересечения и метки.
- Регулируемое смещение сигнала для идеального соответствия эстетике и предпочтениям вашего графика.
5 | 100 % | |
4 | 0 % | |
3 | 0 % | |
2 | 0 % | |
1 | 0 % |


