
PivotLevels
Индикатор
1 покупки
Версия 1.0, Sep 2025
Windows, Mac
4.5
Отзывы: 2
Описание
Индикатор Pivot Points
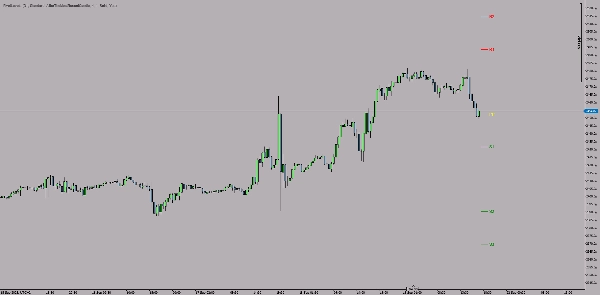
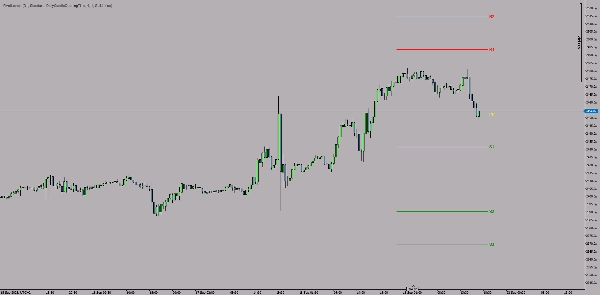
Pivot Points — это технический индикатор для платформы cTrader, который автоматически рассчитывает и отображает pivot points в виде трендовых линий на графике.
Основные характеристики:
🎯 Типы Pivot:
- Стандартные Pivot Points
- Fibonacci Pivot Points
- Woodie Pivot Points
- Camarilla Pivot Points
📊 Уровни:
- Центральный Pivot Point (PP) — жёлтый
- Уровни сопротивления (R1, R2, R3) — красный
- Уровни поддержки (S1, S2, S3) — зелёный
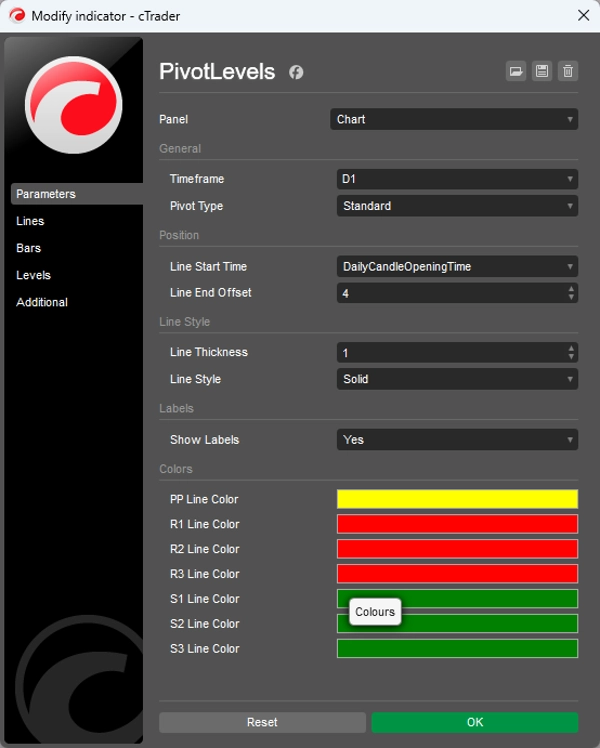
⚙️ Настраиваемые параметры:
- Таймфрейм: Выбор дневного, недельного или другого таймфрейма
- Стиль линии: Толщина (1-5) и тип (сплошная, пунктирная и т.д.)
- Позиционирование: Время начала линии и её длина
- Цвета: Индивидуальная настройка цвета для каждого уровня
- Метки: Включение/выключение текстовых меток
💡 Использование:
Индикатор рассчитывает уровни pivot на основе максимумов, минимумов, закрытия (и открытия) предыдущего периода (дня/недели), что позволяет определить ключевые зоны поддержки и сопротивления для следующего торгового периода.
Идеально подходит для свинг- и дей-трейдеров, использующих стратегии, основанные на технических уровнях.
Сводка
ИИ-сводка
PivotLevels is a technical indicator for the cTrader platform that automatically calculates and displays pivot points as trendlines on trading charts. It supports multiple pivot point calculation methods, including Standard, Fibonacci, Woodie, and Camarilla pivots. The indicator plots key levels such as the Central Pivot Point (PP) in yellow, resistance levels (R1, R2, R3) in red, and support levels (S1, S2, S3) in green.
Users can customize various settings, including the timeframe for pivot calculation (daily, weekly, or others), line style (thickness and type), line positioning (start time and length), colors for each level, and the option to toggle text labels on or off. The pivot levels are derived from the previous period’s high, low, close, and open prices, helping identify potential support and resistance zones for the upcoming trading period.
This indicator is suitable for traders who use technical levels in their strategies, particularly swing and day traders. It supports multiple markets such as forex, indices, commodities, cryptocurrencies, and stocks.
Профиль индикатора
Отзывы покупателей
4.5
Отзывы: 2
5 | 50 % | |
4 | 50 % | |
3 | 0 % | |
2 | 0 % | |
1 | 0 % |
Отзывы покупателей
September 30, 2025
The review gets easier when the decision feels less rushed, and The setup needs patience.
Обсуждение
Частые вопросы
Prop
Forex
Indices
Commodities
Crypto
Stocks
Продукты, доступные в cTrader Store, включая торговых ботов, индикаторы и плагины, предоставляются сторонними разработчиками и доступны исключительно в информационных и технических целях. cTrader Store не является брокером и не предоставляет инвестиционные консультации, персональные рекомендации или какие-либо гарантии будущей доходности.


Цена
С 05/01/2025
14
Продажи