
Beschreibung
https://chartshots.spotware.com/c/695bff3f3bc21
https://chartshots.spotware.com/c/695bffac03fb1
https://chartshots.spotware.com/c/695c0002aabb7
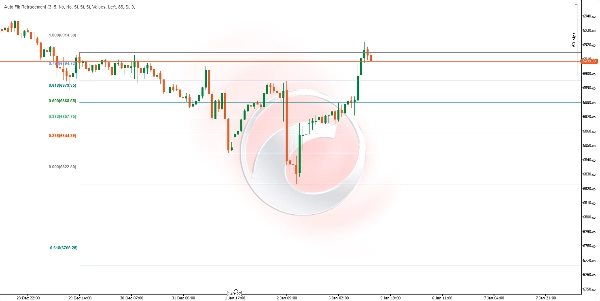
📊 Auto Fib Retracement
Auto Fib Retracement ist ein technischer Analyseindikator, der automatisch Fibonacci-Retracement- und Erweiterungsniveaus zeichnet basierend auf den jüngsten signifikanten Kursbewegungen. Im Gegensatz zu manuellen Fibonacci-Werkzeugen erkennt dieser Indikator Markt-Pivotpunkte automatisch und aktualisiert die Niveaus in Echtzeit.
⚙️ Wie funktioniert es?
Automatische Pivot-Erkennung
Der Indikator verwendet einen dynamischen ZigZag-Algorithmus, um signifikante Kurs-Hochs und -Tiefs zu identifizieren:
- Lookback (Tiefe): Definiert, wie viele Balken rückwärts analysiert werden, um einen Pivotpunkt zu bestätigen. Ein höherer Wert erkennt größere Schwankungen; ein niedrigerer Wert ist empfindlicher gegenüber kleineren Bewegungen.
- Empfindlichkeit (Abweichung): Steuert, wie signifikant eine Kursbewegung sein muss, um einen neuen Pivot zu bilden. Sie wird berechnet, indem der 10-Perioden-ATR (Average True Range) mit diesem Faktor multipliziert wird. Höhere Werte filtern Rauschen heraus und erkennen nur wichtige Bewegungen.
Berechnung der Fibonacci-Niveaus
Sobald die beiden letzten Pivots (ein Hoch und ein Tief) identifiziert sind, berechnet der Indikator jedes Niveau mit der klassischen Fibonacci-Formel:
Niveau = Ankerpreis + (Bewegungsbereich × Fibonacci-Verhältnis)
Dabei gilt:
- Ankerpreis: Der Preis des jüngsten Pivotpunkts (oder des vorherigen, wenn die Richtung sich umkehrt)
- Bewegungsbereich: Die Differenz zwischen den beiden Pivots
- Verfügbare Verhältnisse: 0, 0.236, 0.382, 0.5, 0.618, 0.65, 0.786, 1, 1.272, 1.414, 1.618, 1.65, 2.618, 2.65, 3.618, 3.65, 4.236, 4.618, und negative Niveaus (-0.236, -0.382, -0.618, -0.65)
📈 Wofür ist es?
UseDescription
Unterstützungs- und Widerstandsniveaus identifizieren
Niveaus 0.382, 0.5 und 0.618 sind klassische Zonen, in denen der Kurs typischerweise reagiert 🔵
Preisziele definieren
Erweiterungsniveaus (1.618, 2.618, 3.618, 4.236) helfen dabei abzuschätzen, wie weit eine Bewegung gehen könnte 🎯
Einstiege planen
Suchen Sie nach Rücksetzern zu Schlüssel-Niveaus, um in Trendrichtung einzusteigen ⬆️⬇️
Stop-Loss setzen
Platzieren Sie Stops jenseits relevanter Fibonacci-Niveaus 🛑
Umkehrzonen bestätigen
Wenn der Kurs extreme Erweiterungsniveaus erreicht, kann dies auf Erschöpfung hinweisen 🔄
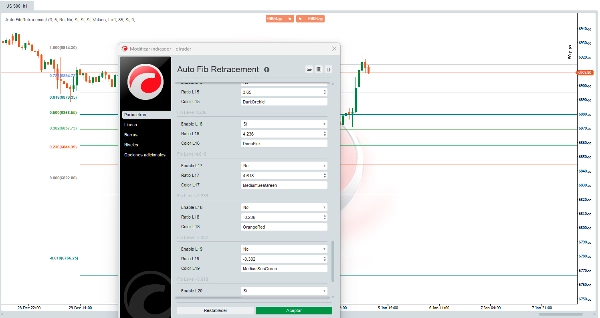
🛠️ Wie man es benutzt
Hauptparameter
ParameterBeschreibungEmpfohlener Wert
Empfindlichkeit
Abweichungs-Multiplikator zur Filterung kleiner Bewegungen
3 (Standard)
Lookback
Minimale Anzahl von Balken zur Berechnung der Pivots
10 (Standard)
Richtung umkehren
Kehrt den Referenzpunkt für die Niveau-Berechnung um
Deaktiviert
Anzeigeoptionen
OptionFunktion
Links / Rechts erweitern
Erweitert horizontale Linien nach links oder rechts im Chart
Preise anzeigen
Zeigt den genauen Preis jedes Niveaus an
Verhältnisse anzeigen
Zeigt das Fibonacci-Verhältnis (Werte oder Prozentsatz)
Position der Beschriftung
Positioniert Labels links oder rechts
Zonen-Transparenz
Steuert die Transparenz der farbigen Zonen zwischen den Niveaus
Konfigurierbare Fibonacci-Niveaus
Jedes der 22 Niveaus kann:
- Einzeln aktiviert oder deaktiviert werden
- Seinen numerischen Wert geändert bekommen
- Seine Farbe geändert bekommen
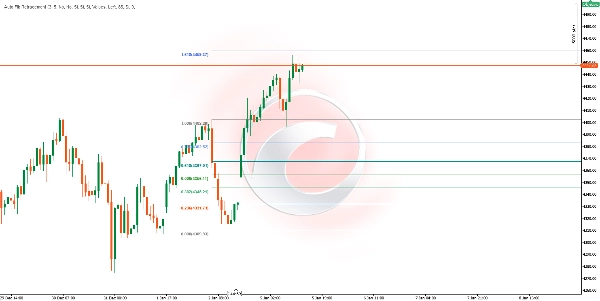
💡 Interpretation der Zonen
Farbige Zonen zwischen aufeinanderfolgenden Niveaus erleichtern die visuelle Identifikation:
- Grün/Blaue Zonen (0.382 - 0.786): Bereich eines gesunden Rücksetzers in Trends. Häufige Zone für Einstiege. ✅
- Zone bei Niveau 1.0: Repräsentiert 100 % der vorherigen Bewegung. Dient als wichtiger Unterstützungs-/Widerstandspunkt. ⚖️
- Rot/Rosa Zonen (1.618+): Erweiterungen der Bewegung. Das Erreichen dieser Zonen kann auf Überdehnung hinweisen. ⚠️
⚠️Überlegungen
- Der Indikator aktualisiert sich automatisch wenn neue signifikante Pivots erkannt werden
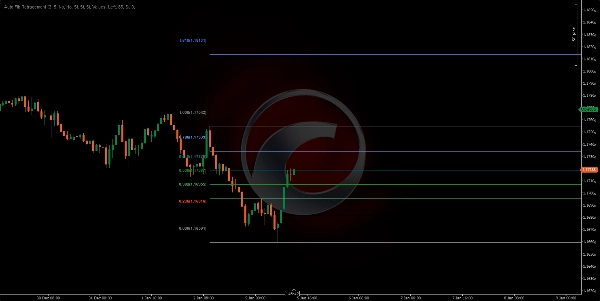
- Er funktioniert auf jedem Zeitrahmen und Finanzinstrument
- Fibonacci-Niveaus sind Wahrscheinlichkeitszonen, keine Garantien
- Empfohlen wird die Nutzung in Kombination mit anderen Indikatoren oder der Kursanalyse
- In Seitwärts- oder unruhigen Märkten können sich Pivots häufig ändern
📝 Technische Hinweise
- Der 10-Perioden-ATR wird intern verwendet, um die dynamische Schwelle für die Pivot-Erkennung zu berechnen
- Der Indikator benötigt eine minimale historische Datenmenge, die dem Doppelten des Lookback-Parameters entspricht um korrekt zu funktionieren
- Linien und Zonen werden nur am letzten Balken neu gezeichnet zur Optimierung der Leistung 🚀


