
说明
🚀 超过10,000名交易者已经使用我们的顶级 指标🏆
发现为什么专业人士选择我们——最强大的工具 cTrader(指标、算法和cBots)正等着您。
👉 在这里获取我们所有的顶级系统:
_______________________________________________
📌 市场结构指标
· ✅ AdvancedMarket Structure: Bos, Choch, SwinLevels, Order Blocks, Market Structure& Liquidity Finder
· 🔄 动态市场结构转折点分析
· 🧱 订单区块
· ⚖️ 市场失衡
· ⛓️ BOS & CHOCH
· 🧠 ICT 三力合一
· 🌀 市场极性区域
_______________________________________________
🔚 智能退出系统
· 📍 跟踪智能算法
_______________________________________________
📐 之字形指标
· 🔍 之字形价格流动性投影
· 🧭 支撑阻力结构之字形
· ➖ 之字形
· 🎯 之字形极限追踪器
_______________________________________________
🧱 支撑与阻力指标
· 🟩 智能趋势支撑与阻力线
· 🧱 所有支撑和阻力水平
_______________________________________________
📊 趋势与通道指标
· 🔄 自动趋势通道
· 📊 超级趋势
· ⚡动量趋势分析器
· 🧠 自适应趋势通道
· 💥 通道突破系统
· 🌈 动态趋势渐变
· ⭐ 高级SSL通道
· 🔁 反应式移动平均线
_______________________________________________
💧 成交量与流动性工具
· 🔥 成交量POC热力图
· 📉 杠杆清算图
· 🔍 动量公平价值缺口
· 🕒 公平价值缺口时段
_______________________________________________
⚡ 动量与RSI指标
· 📈 RSI趋势触发器
· 🚀 动态区间动量
· 🔎 多级蜡烛偏差
追踪器
_______________________________________________
🔮 预测与投影工具
· 📐 基于线性回归和ATR的预测
· 📏 斐波那契线性回归多时间框架
· 📈 成交量驱动的市场流动投影器
______________________________________________________________________________________________
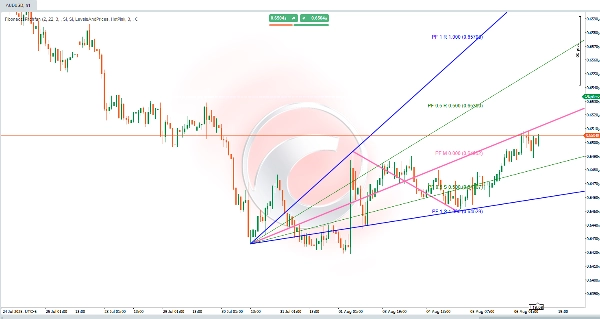
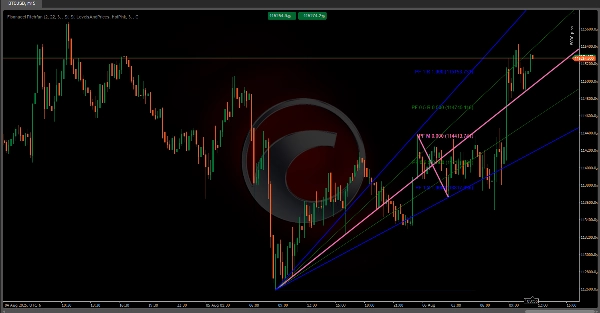
斐波那契扇形线 📊✨
一款 高级技术指标,结合了 枢轴点检测、 动态趋势线和 斐波那契水平,创建一个 可视化工具,帮助交易者识别趋势、支撑/阻力区域及潜在反转点。🎯 高度可定制,能通过配置参数适应不同的交易风格。以下是其逻辑和计算的详细说明。
核心组成部分 🔧
该指标依赖于 三个关键元素 协同工作:
1. 枢轴点检测 🔄
- 识别 关键价格反转点(高点/低点枢轴)。
- 使用 用户定义的柱范围(枢轴深度)来判断某柱是否为相较周围柱的显著高点/低点。
- 通过要求枢轴点超过基于ATR的 偏差阈值来过滤噪音,确保只考虑 相关价格波动。
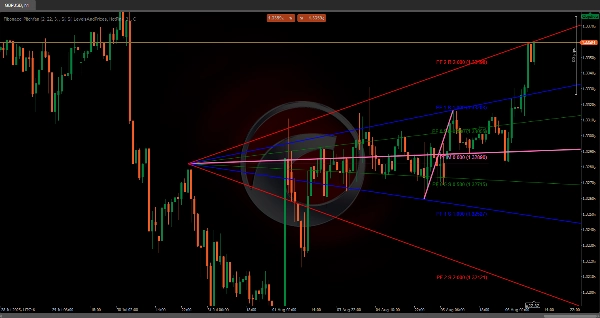
2. 趋势扇形线与斐波那契水平 📐
- 从历史枢轴点向未来投射一组 动态趋势线扇形,使用预定义水平(如0.25、0.5、1.0)标记潜在的 支撑/阻力。
- 可选的斐波那契水平(水平线)突出显示关键枢轴间的 回撤/扩展。
计算逻辑 🧮
1. 枢轴点识别
- 算法对每根柱扫描一个 对称范围,包括前后柱(基于枢轴深度)。
- 如果该柱的最高价是范围内的 最高点,则确认为高枢轴;如果最低价是 最低点,则为低枢轴。
- 偏差阈值(相对于价格的ATR百分比)过滤掉小幅波动,聚焦于 有意义的市场波动。
2. 趋势扇形线生成 🌪️
- 一个 参考历史枢轴点(可配置)与最新枢轴点配对,形成基线。
- 在两点间绘制一条 中线,并在预定义水平上投射趋势线,延伸至未来,形成一组“扇形”的 关键价格区域。
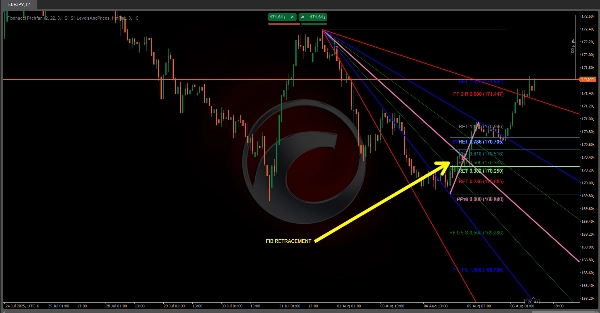
3. 斐波那契投影 🔢
- 回撤水平(如0.236、0.5、0.618)标记先前价格走势中的潜在 回调区域。
- 扩展水平投射超出初始范围的 价格目标,并根据趋势方向调整。
- 水平可以根据用户设置被 反转或扩展。
可定制设置 ⚙️
- 偏差阈值:调整对价格变动的敏感度(基于ATR)。
- 枢轴深度:定义枢轴检测的柱范围(影响信号频率)。
- 历史参考:设置用于趋势扇形线的初始枢轴点的回溯距离。
- 可见性:切换趋势扇形线/斐波那契显示并选择显示的具体水平。
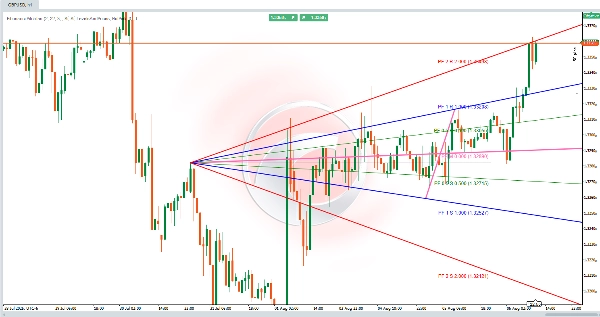
结论 🏆
斐波那契扇形线是一款 强大的多合一工具,适合寻求 清晰、动态市场结构视图的交易者。通过融合 枢轴点、趋势线和斐波那契水平,它提供了可操作的洞察,帮助 预测价格走势并做出明智决策。🚀
摘要
It generates a "TrendFan" by projecting dynamic trendlines from a configurable historical pivot to the latest pivot, creating a fan of key price zones. Optional Fibonacci retracement and extension levels highlight potential pullback areas and price targets, which can be customized or inverted according to user preferences.
Key customizable settings include deviation threshold sensitivity, pivot depth (bar range for pivot detection), historical reference for the initial pivot selection, and visibility options for TrendFan and Fibonacci levels. This tool is suitable for traders seeking actionable insights to anticipate price movements and make informed decisions based on a comprehensive view of market dynamics.


