
Volume POC Heatmap
指标
3.43K 下载
版本 1.0, Feb 2025
Windows 版、Mac 版
5.0
评价:4

说明
Pinescriptlabs 商店指标: Pinescriptlabs 商店 cBots : (cBot) Gold & BTC 突破会话枢轴(新)
高级市场结构:Bos、Choch、SwinLevels、订单区块, 市场结构与流动性发现器(新)
智能跟踪算法 (新)
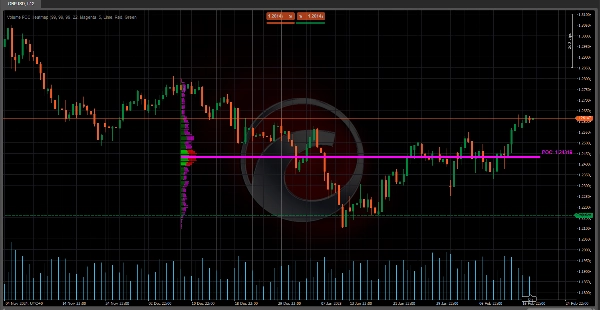
🔥 成交量 POC 热力图 🔥
该指标是一个 成交量轮廓,显示特定期间内不同价格水平的交易量分布。其主要目标是识别关键的 支撑/阻力区域 以及市场表现出最大兴趣的区域(高买卖活动)。它非常适用于:
- 检测控制点 (POC) 🎯
成交量最高的价格水平,作为价格行为的磁石。 - 可视化价值区 (VA)
特定百分比的总成交量集中区域(例如 70%),表示买卖双方的平衡。 - 区分看涨和看跌成交量 📈📉
显示买方力量与卖方压力的积累位置。
🧠 关键逻辑与计算 🔢
- 价格区间划分 📏
-
- 价格区间(从最近 B 根 K 线 的最低到最高)被划分为 成交量单元 (CNum) 。
示例:如果 CNum = 33 ,则区间被分割成 33 个等距水平。
- 价格区间(从最近 B 根 K 线 的最低到最高)被划分为 成交量单元 (CNum) 。
- 按级别分布成交量 📊
-
- 对于历史数据中的每根 K 线:
-
- 计算与实体(开盘与收盘差)和影线(最高与最低)相关的成交量。
- 成交量按比例分配到被该 K 线穿过的价格单元。
示例:如果一根绿色(看涨)K 线覆盖 3 个单元,成交量主要分配给这些单元,作为“看涨成交量”。
- 控制点 (POC) 计算 🎯
-
- POC 是累计成交量最高的单元,代表买卖双方达成最多共识的价格。
- 价值区 (VA) 计算 🔄
-
- 从 POC 向上/向下扩展,直到包含指定百分比的总成交量(例如 70%)。
示例:如果 VA 范围是 100 到 105 ,表示 70% 的成交量在该区间内交易。
- 从 POC 向上/向下扩展,直到包含指定百分比的总成交量(例如 70%)。
- 视觉归一化 🖼️
-
- 使用 缩放因子 调整图表上条形的宽度,便于可视化。
🛠️ 成交量 POC 热力图的关键 💡
- 传统成交量指标缺乏上下文 🤔
经典成交量指标(如逐根 K 线成交量)无法显示成交量发生的位置。该指标通过价格水平映射成交量,解决了这一问题。 - 有机支撑/阻力识别 🚀
高成交量区域作为动态支撑/阻力,比静态线更可靠。 - 失衡检测 ⚖️
以看涨或看跌成交量为主的区域预示潜在突破或反转。
💡 交易中的实际应用 📈
- POC 作为关注区 🎯
-
- 当价格接近 POC 时,预期会有反应,如反弹或盘整。
- 价值区 (VA) 作为平衡区 🔄
-
- 价格在 VA 外时,倾向于回归(磁性效应)。
- 价格在 VA 内时,可能表示盘整。
- 看涨/看跌成交量作为确认 🔍
-
- 阻力位看涨成交量激增表明潜在突破。
- 支撑位高看跌成交量表明可能下破。
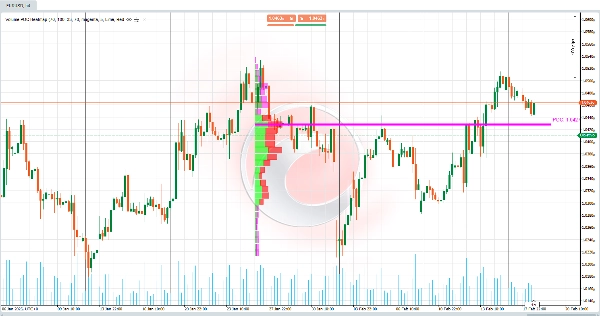
🌟 示例 📊
使用的参数(用户可见且可配置):
- 回溯 K 线数 = 55 → 分析的历史 K 线数量。
- 成交量单元数 = 33 → 价格区间的划分单元数。
- 价值区成交量百分比 = 70 → 定义价值区的成交量百分比。
情境:
- 价格突破一个技术支撑位,但该区域的成交量较低(根据轮廓显示)。
- 随后,价格回归到由 70% 总成交量定义的 价值区 (VA) 。
解读:
- 突破是假突破(因突破区成交量低)。
- 市场试图在 价值区 内重新平衡,该区活动更高(成交量密度大)。
行动:
- 在 VA 下限或 POC 附近寻找买入机会,因为这些是市场参与者高度关注的区域。
摘要
AI 摘要
Volume POC Heatmap is a volume profile indicator that visualizes the distribution of traded volume across price levels over a specified historical period. It identifies key market areas such as the Point of Control (POC)—the price level with the highest traded volume—and the Value Area (VA), which encompasses a configurable percentage (e.g., 70%) of total volume, indicating zones of buyer-seller balance. The indicator differentiates bullish and bearish volume by distributing volume proportionally across price cells intersected by each bar, highlighting areas of buying power versus selling pressure.
Key functionalities include:
- Division of the price range into multiple volume cells for detailed volume mapping.
- Calculation of POC as the volume consensus price.
- Determination of the Value Area around the POC.
- Visual normalization of volume bars for clearer chart representation.
This tool addresses the limitation of traditional volume indicators by showing where volume was traded rather than just total volume per bar. It helps identify dynamic support and resistance zones based on volume concentration and detects volume imbalances that may signal potential breakouts or reversals. Traders can use it to anticipate price reactions near the POC and VA, aiding in decision-making for entries and exits. Configurable parameters include the number of historical bars analyzed, volume cells, and the percentage defining the Value Area.
指标配置
客户评价
5.0
评价:4
5 | 100 % | |
4 | 0 % | |
3 | 0 % | |
2 | 0 % | |
1 | 0 % |
客户评价
September 7, 2025
Me gusta por la forma en que representa los datos, un poco molesto con el parpadeo, pero es soportable. 😀
July 9, 2025
Pros: Visualizes volume concentration and POC zones as a heatmap. Helps spot high-interest price levels. Stable performance, easy to use. Cons: No tooltips or alerts. Limited customization for transparency and color. Requires other tools for precise trading signals.
June 22, 2025
讨论
常见问答
BTCUSD
Signal
Breakout
Supertrend
Commodities
RSI
Crypto
XAUUSD
ATR
cTrader Store 提供的所有产品,包括交易机器人、指标和插件,均由第三方开发者提供,仅供信息参考和技术访问之用。cTrader Store 并非经纪商,不提供投资建议、个人推荐或任何未来业绩保证。


价格
注册日期 03/10/2024
163
销售
39.1K
免费安装