
说明
Chaikin资金流量的主要目的是 区分证券的积累期和分配期。当指标位于零线以上时,表示该证券正经历净积累,表明投资者正在买入该资产。
- Chaikin资金流量设置值超过30会使指标不那么敏感。这将导致信号更少,但质量更好。
- Chaikin资金流量设置值低于20会使指标过于敏感。这将导致更多的市场噪音。
- 当CMF指标从上方向下穿越零线并产生多头/买入信号时,表示持续的上升趋势。
- 当CMF指标从下方向上穿越零线并产生空头/卖出信号时,表示持续的下降趋势。
摘要
AI 摘要
The Chaikin Money Flow (CMF) indicator is designed to identify periods of accumulation and distribution for a security. When the CMF value is above zero, it signals net accumulation, indicating buying pressure. Conversely, values below zero suggest distribution or selling pressure. The indicator’s sensitivity can be adjusted: settings above 30 reduce sensitivity, producing fewer but higher-quality signals, while settings below 20 increase sensitivity, resulting in more market noise. Key signals include a continued uptrend when the CMF crosses the zero line from above, generating buy signals, and a continued downtrend when it crosses from below, generating sell signals. This tool helps traders assess buying and selling momentum to inform trading decisions.
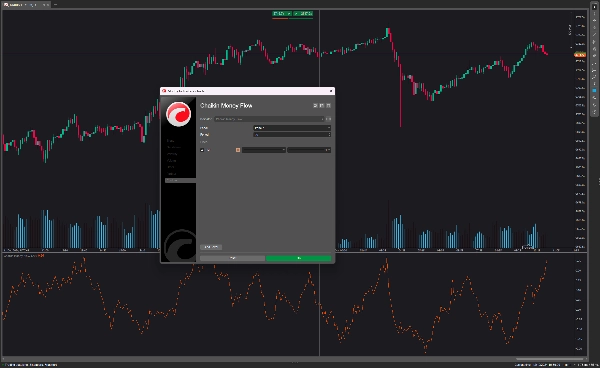
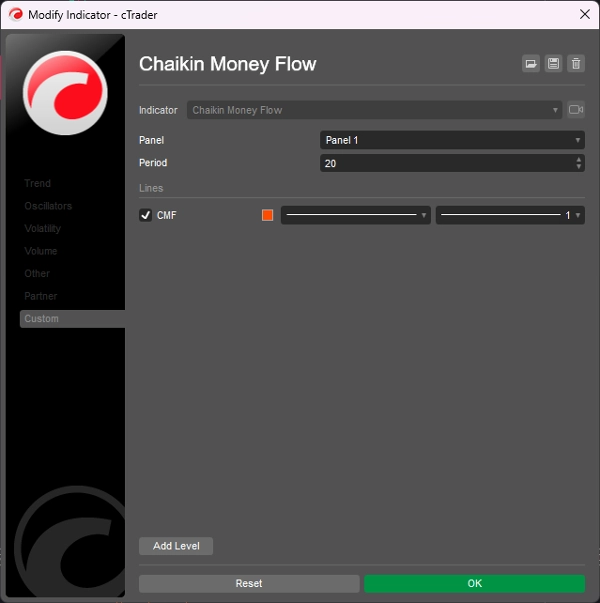
指标配置
客户评价
5.0
评价:1
5 | 100 % | |
4 | 0 % | |
3 | 0 % | |
2 | 0 % | |
1 | 0 % |
客户评价
August 18, 2025
Reliable volume-based trend confirmation, easy to read, customizable period. Cons: No alerts, no MTF analysis, limited filtering options.
讨论
常见问答
cTrader Store 提供的所有产品,包括交易机器人、指标和插件,均由第三方开发者提供,仅供信息参考和技术访问之用。cTrader Store 并非经纪商,不提供投资建议、个人推荐或任何未来业绩保证。


价格
2
销售
6.89K
免费安装