
说明
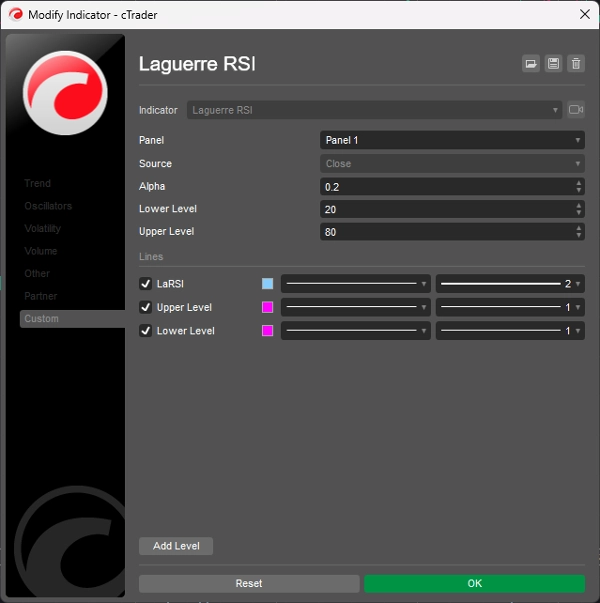
Laguerre RSI 基于 John EHLERS 的 Laguerre 滤波器,以避免 RSI 的噪音。
改变 alpha 系数以增加/减少滞后和平滑度。
the
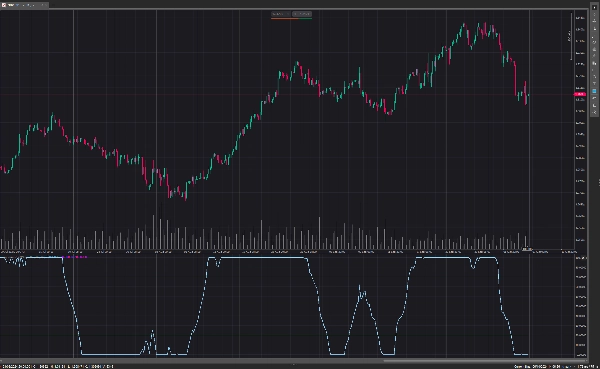
当 Laguerre RSI 向上穿过 20 时买入。
当 Laguerre RSI 向下穿过 80 时卖出。
当指标在 80 以上持平时,上升趋势强劲。
当指标在 20 以下持平时,意味着下降趋势强劲。
摘要
指标配置
客户评价
5.0
评价:1
5 | 100 % | |
4 | 0 % | |
3 | 0 % | |
2 | 0 % | |
1 | 0 % |
客户评价
July 14, 2025
Pros: Smooths RSI using Laguerre filter, reducing noise and lag. Clear overbought/oversold levels. Great for scalping. Cons: No alerts or tooltips. Requires confirmation with trend filters. Lacks setting templates and advanced features.
讨论
常见问答
RSI
cTrader Store 提供的所有产品,包括交易机器人、指标和插件,均由第三方开发者提供,仅供信息参考和技术访问之用。cTrader Store 并非经纪商,不提供投资建议、个人推荐或任何未来业绩保证。
该作者的其他作品


价格
2
销售
6.89K
免费安装