
说明
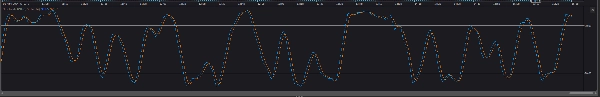
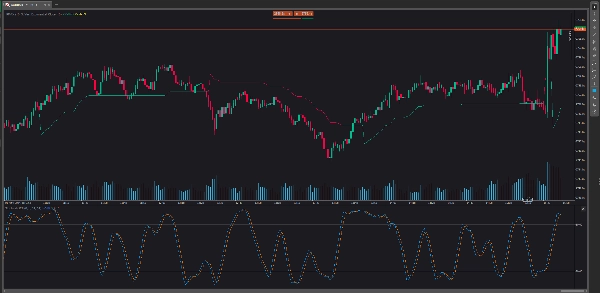
随机相对强弱指数(StochRSI)是一种技术分析指标,通过比较证券的价格范围与其收盘价来辅助股市预测。StochRSI 的独特之处在于它侧重于市场动量,擅长识别超买和超卖的市场状况。StochRSI 与其他技术指标(如相对强弱指数 RSI)不同,因为它比 RSI 更快地从超买价格移动到超卖价格。
摘要
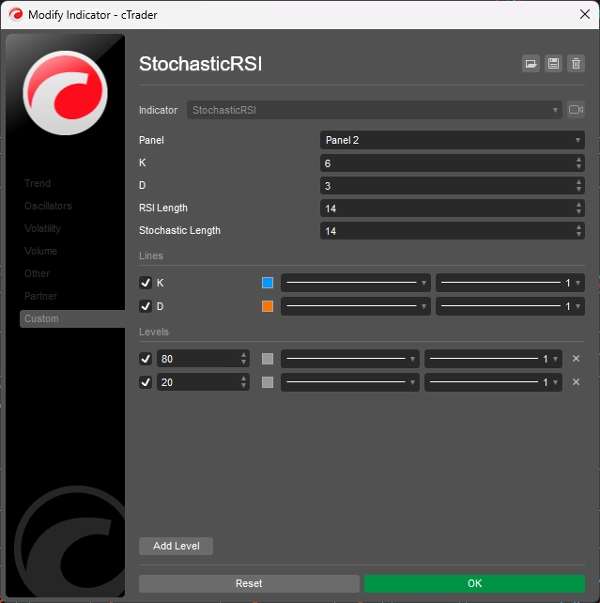
指标配置
客户评价
5.0
评价:1
5 | 100 % | |
4 | 0 % | |
3 | 0 % | |
2 | 0 % | |
1 | 0 % |
客户评价
July 9, 2025
Pros: Combines Stochastic Oscillator and RSI for improved overbought/oversold detection. Easy to set up, stable on all timeframes. Cons: No tooltips or alerts. Requires confirmation from trend indicators to avoid false signals. Limited customization options.
讨论
常见问答
Indices
RSI
cTrader Store 提供的所有产品,包括交易机器人、指标和插件,均由第三方开发者提供,仅供信息参考和技术访问之用。cTrader Store 并非经纪商,不提供投资建议、个人推荐或任何未来业绩保证。
该作者的其他作品


价格
2
销售
6.89K
免费安装