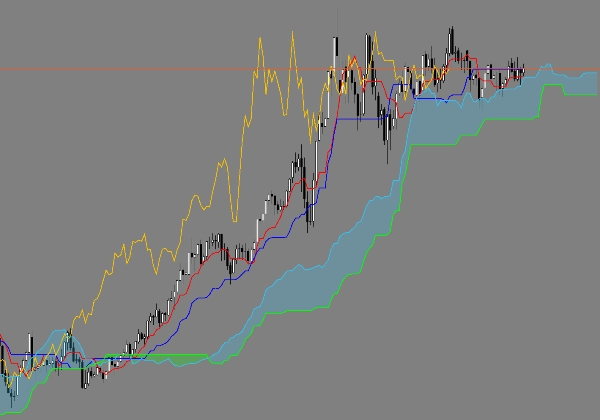
Ichimoku Kinko Hyo
"Ichimoku Kinko Hyo" 标识
20/07/2025
28
Desktop
Since 20/03/2025
Free installs
28

This is a corrected Ichimoku Kinkō Hyō indicator for cTrader. By default, cTrader’s displacement is 26 and starts counting from zero, which causes the Chikou Span and the Kumo (cloud) to be shifted incorrectly. This version fixes that by using a fixed 25-period shift for both the Chikou Span (moved 25 periods back) and Kumo lines (moved 25 periods forward), matching the original Japanese specification and platforms like TradingView. This ensures all Ichimoku lines are calculated and plotted in the correct positions for accurate signals and analysis.

猜您喜欢
评分最高
免费
指标
VWAP
VWAP Pro
Advanced VWAP with up to 30 anchored levels, multiple timeframes, memory mode, standard deviation bands & simple GUI
指标
Grid
NAS100
NZDUSD
+15
RangeBoxFibonacci
With this Fibonacci retracement indicator, traders have full control over the retracement levels displayed on the chart.
calculateSpreads_withSourceCode
Indicator calculates spread in pips
指标
RSI
Indices
Signal
Rsi + Volume
This indicator combines RSI (Relative Strength Index) with volume analysis to generate more reliable trading signals.
指标
ATR
Forex
RISK V1
Automated position sizing based on risk, entry, and stop loss with ATR support and visual trade setup on charts.
PVA Volume+Analysis_noSourceCode
PVA Volume Analysis Indicator:Price volume over trend strength and direction
Moving Average Plus
10 configurable moving averages: choose type, period, color per line; single price source for all.
指标
Signal
Half Trend BT
Half Trend BT by BullittTraders
指标
Bollinger
Repiptor BB Width
Bollinger Bands Width
指标
Indices
Commodities
Forex
+2
Two Candle Patterns
Detect powerful 2-candle reversal patterns at key highs/lows. Boost entries with real-time alerts and visual signals.
zh-cn Variety Period time panel(multilanguage)
This indicator can be used to: change color, shape size, position, change font, increase or decrease, and other function
指标
RSI
Breakout
Supertrend
+1
Momentum Fair Value Gap
It identifies areas of market imbalance (Fair Value Gaps or FVGs) and projects them on the chart in a smart way
xhobaniFX_ADR-Lines
xhobaniFX_ADR-Lines: Average Daily Range Horizontal Lines
MultiTimeFrame Moving Averages
3 moving averages with different periods and different time frames.
Vishal Volume Profile v2.0
Volume Profile plots traded volume at each price level, highlighting high activity zones of precise support & resistance
指标
RSI
Breakout
Lozano Price Action
LPA simplifies trading by coloring candles with volume data and RSI levels for trend and reversal insights.
指标
ATR
Stocks
Commodities
+2
LevelMaster SR
LevelMaster S/R: Pinpoint key support & resistance zones with precision. Perfect for traders of all levels Trade smarter
Candelstick xxl
The indicator is designed to detect aggressive movements in the market and without volume for trend changes.