"Ichimoku Cloud Indicator" 标识
指标
179 下载
版本 1.0, Mar 2025
Windows 版、Mac 版
"Ichimoku Cloud Indicator" 已上传图片
2
销售
6.58K
免费安装

一目均衡表分析综合指南

历史与背景

一目均衡表(或称一目云图)由日本记者细田悟一于1930年代末期开发。经过多年与助手团队的研究和回测,细田于1969年发布了他的研究成果。“一目均衡表”意为“一目了然的均衡图”,反映了其设计目的:让交易者能够在一个视图中快速评估市场行为的多个方面。

细田的创新非常了不起,因为他在计算机分析尚未普及的几十年前就创建了这个复杂的系统,所有计算均手工完成。一目系统的独特之处在于其整体方法,将多个时间框架和市场分析维度整合到统一的框架中。

一目均衡表的五个组成部分

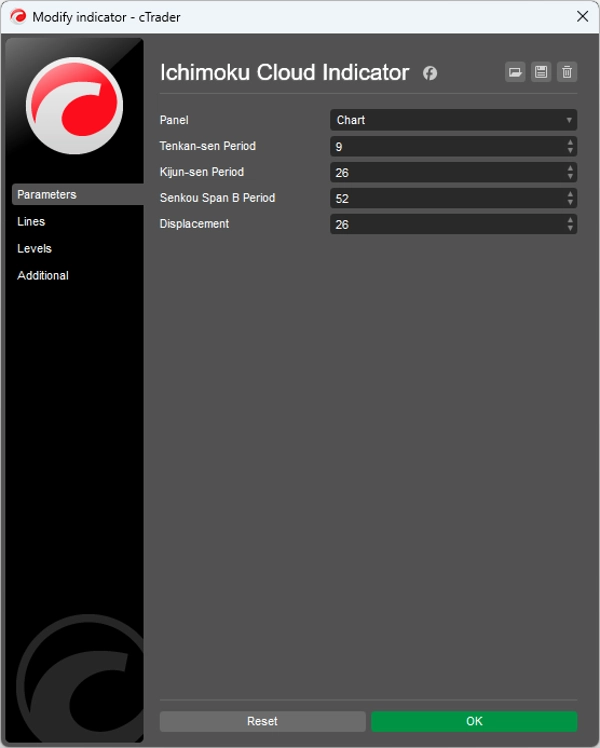
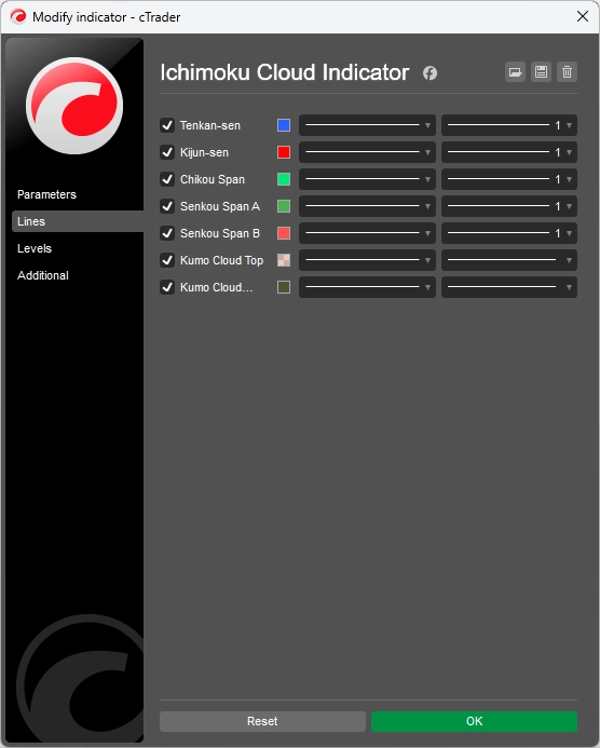
一目云图由五条不同的线组成,每条线提供特定的见解:

1. 转换线(Tenkan-sen)

  • 计算方法:(过去9个周期内最高价 + 最低价)/ 2
  • 功能:代表短期市场动量
  • 解读:作为动态支撑/阻力位和趋势指标

2. 基准线(Kijun-sen)

  • 计算方法:(过去26个周期内最高价 + 最低价)/ 2
  • 功能:代表中期市场动量
  • 解读:作为更强的支撑/阻力位,可用作移动止损

3. 先行A线(Senkou Span A)

  • 计算方法:(转换线 + 基准线)/ 2,向前绘制26个周期
  • 功能:形成云图(Kumo)的前沿
  • 解读:预测支撑/阻力位

4. 先行B线(Senkou Span B)

  • 计算方法:(过去52个周期内最高价 + 最低价)/ 2,向前绘制26个周期
  • 功能:形成云图(Kumo)的后沿
  • 解读:预测支撑/阻力位

5. 延迟线(Chikou Span)

  • 计算方法:当前收盘价,向后绘制26个周期
  • 功能:确认趋势并识别潜在反转
  • 解读:当位于价格之上,表示看涨;当位于价格之下,表示看跌
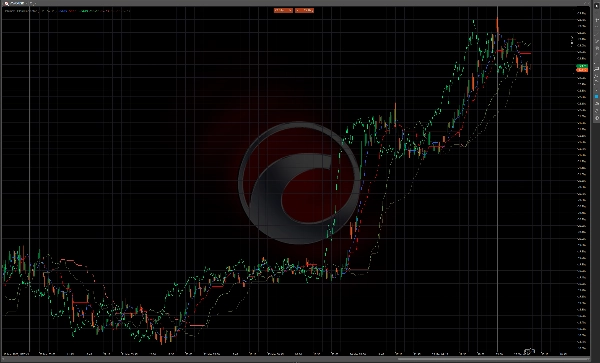
云图(Kumo)

先行A线和先行B线之间的区域称为“云”或“Kumo”。云代表潜在的支撑和阻力区域,其厚度表示市场波动性及这些区域的强度。

  • 厚云:强支撑/阻力,更高波动性
  • 薄云:较弱支撑/阻力,较低波动性
  • 看涨云:先行A线高于先行B线(通常为绿色)
  • 看跌云:先行B线高于先行A线(通常为红色)

交易规则与信号

趋势判定

  1. 看涨趋势标准
    • 价格位于云之上
    • 转换线高于基准线
    • 延迟线高于26周期前的价格
    • 先行A线上升且高于先行B线(看涨云)
  2. 看跌趋势标准
    • 价格位于云之下
    • 转换线低于基准线
    • 延迟线低于26周期前的价格
    • 先行A线下降且低于先行B线(看跌云)
  3. 中性/区间震荡市场
    • 价格位于云内
    • 转换线和基准线平坦或频繁交叉

入场信号

看涨入场信号

  1. TK交叉(转换线/基准线交叉)
    • 转换线向上穿过基准线
    • 价格位于云之上时效果最佳
    • 云为看涨时信号更强
  2. 云突破
    • 价格从云下或云内突破至云之上
    • 前方云为看涨(先行A线 > 先行B线)时信号更强
  3. 延迟线确认
    • 延迟线向上穿过26周期前的价格
    • 延迟线前方无阻力

看跌入场信号

  1. TK交叉(看跌)
    • 转换线向下穿过基准线
    • 价格位于云之下时效果最佳
    • 云为看跌时信号更强
  2. 云突破(看跌)
    • 价格从云上或云内跌破至云之下
    • 前方云为看跌(先行B线 > 先行A线)时信号更强
  3. 延迟线确认(看跌)
    • 延迟线向下穿过26周期前的价格
    • 延迟线前方无支撑

出场信号

  • 趋势反转:当出现相反趋势的标准时
  • TK交叉:转换线反向穿过基准线时
  • 云触及:价格触及云的相反一侧时
  • 延迟线警告:延迟线接近历史价格水平时

支撑与阻力水平

  • 即时支撑/阻力:转换线和基准线
  • 中期支撑/阻力:云(平坦部分更强)
  • 云转折:先行A线和B线交叉,形成潜在反转点

高级一目技术

1. 云转折(Kumo Twist)

当先行A线和先行B线交叉时,形成未来26周期的潜在反转点。交易者常用此作为潜在趋势变化的早期警告信号。

2. 多时间框架分析

许多一目交易者分析多个时间框架:

  • 较高时间框架用于整体趋势方向
  • 中等时间框架用于入场信号
  • 较低时间框架用于精确入场时机

3. 先行线的扩张/收缩

  • 云扩张:市场波动性增加,趋势更强
  • 云收缩:波动性降低,趋势可能减弱

4. 平坦云(Flat Kumo)

当两条先行线平行运行时,通常表示强趋势并具有明确的支撑/阻力水平。

实际应用

理想市场条件

一目云图在趋势市场和所有时间框架中表现最佳。它可应用于:

  • 外汇
  • 股票
  • 商品
  • 加密货币
  • 指数

风险管理

  • 使用云作为动态止损位
  • 根据云的厚度调整仓位大小(云越厚,波动性越高)
  • 在强趋势中考虑将基准线作为移动止损

时间框架兼容性

传统设置(9, 26, 52)基于日本的6天交易周,因此一些交易者会调整这些设置:

  • 日线图使用10, 30, 60
  • 更保守信号使用20, 60, 120
  • 西方市场(5天交易周)使用7, 22, 44

结论

一目云图提供了一个综合的交易系统,在一个视图中提供多层次的市场信息。其强大之处不仅在于单个信号,而在于多个指标的汇聚。当所有组成部分一致时,一目系统可以提供高概率的交易机会,并具有明确的风险参数。

虽然初看复杂,但通过练习,交易者确实可以如细田所愿“一目了然”地评估市场状况。系统的时间移动组件还提供了独特的市场动态视角,使交易者能够在潜在的未来支撑和阻力位变得相关之前看到它们。

指标配置
0.0
评价:0
客户评价
该产品尚无评价。已经试过了?抢先告诉其他人!
Forex
Signal
Breakout
Indices
Commodities
Stocks
cTrader Store 提供的所有产品,包括交易机器人、指标和插件,均由第三方开发者提供,仅供信息参考和技术访问之用。cTrader Store 并非经纪商,不提供投资建议、个人推荐或任何未来业绩保证。

该作者的其他作品

"PMAX" 标识
评分最高
5.0
(6)
免费
指标
ATR
Supertrend
It's a combination of two trailing stop loss and the other one is well-known ATR-based SuperTrend.
cBot
ATR
RSI
+19
Trading system combining martingale strategy with multi-layered technical analysis and comprehensive protection features
指标
RSI
Indices
Stochastic RSI (StochRSI) is a technical indicator used to measure the strength and weakness of the RSI.
指标
AI
Indices
The Machine Learning Momentum Index (MLMI) represents the next step in oscillator trading.
指标
RSI
Laguerre RSI is based on John EHLERS' Laguerre Filter to avoid the noise of RSI.
指标
The KDJ oscillator display consists of 3 lines (K, D and J - hence the name of the display) and 2 levels.
指标
Forex
Breakout
On Balance Volume (OBV) measures buying and selling pressure as a cumulative indicator.
指标
Signal
Stocks
+1
The Darvas Box involves identifying "boxes" or trading ranges where a stock's price consolidates before breaking out.
指标
RSI
The QQE (Quantitative Qualitative Estimation) Weighted Oscillator improves its original version by weighting the RSI.
cBot
Grid
Martingale
This is a basic martingale bot without an indicator. For long and short trading options at the same bot.
指标
Chaikin money flow's primary purpose is to distinguish between periods of accumulation and distribution of a security.

猜您喜欢

指标
Key Levels
Order Block
+5
FVG Levels — Auto-Detection of Multi-Timeframe Fair Value Gaps & GAPs, Smart Filters and Liquidity Zone Monitoring
指标
ATR
Key Levels
It combines the trend-filtering power of Renko charts with the volatility tracking of ATR Bands
指标
Key Levels
Support & Resistance
6 pivot systems + (LevelPivot by VMM). FULLY customizable: highlight ANY level, hide far levels, YOUR colors, YOUR style
指标
VWAP
Volume
+5
On the 5M timeframe chart of the daily VWAP indicator, price reactions in fair value and deviation zones are beneficial.
指标
ATR
Prop
+13
Enhance trading with ATR Bands! Visualize market volatility using dynamic upper and lower ATR bands for precise decision
指标
Forex
EURUSD
+3
Forex Strength Meter for cTrader: 4 custom currencies, cross alerts, visual arrows. Trade smarter!
指标
Prop
Forex
+11
🌊 See when the market is truly in play. Tsunami measures Relative Volume by time-of-day 🌊
指标
Supertrend
Liquidity Grab
+1
Auto Detect Session Indicator Trend for Intraday Trading
指标
Forex
BTCUSD
+13
Cross EMA Pro – Trend Reversal Indicator
指标
VWAP
Volume
+5
The MA Quant Volume Profile Custom Range is a trading indicator that analyzes volume distribution across the price.
指标
Prop
Forex
+4
HMA MTF 2.0 (Multi-Timeframe )
指标
Indicator for my Bot
指标
Forex
BTCUSD
+11
Unlock trading precision with QQE! Dual QQE indicators with a Bollinger Bands zero line provide clear buy/sell signals.
指标
Forex
BTCUSD
+10
Belkhayate PRC (Polynomial Regression Channel)
指标
Forex
BTCUSD
+12
🎯Automatically identifies the market's significant turning points (key H & L) and draws dynamic support and.....✍️
指标
Grid
Prop
+16
Those who are involved in trading know how important it is to take into account the previous session. With Order Block
指标
Fair Value Gap
FVG Detector: Identify and label Fair Value Gaps, with age, status & multi-timeframe support.
指标
RSI
Prop
+14
Unlock Stochastic RSI PRO in cTrader! Overlay RSI, highlight zones, and identify divergences with customizable settings.
2
销售
6.58K
免费安装