
On Balance Volume
Indikator
253 downloads
Version 1.0, Dec 2024
Windows, Mac
5.0
Bewertungen: 1
Beschreibung
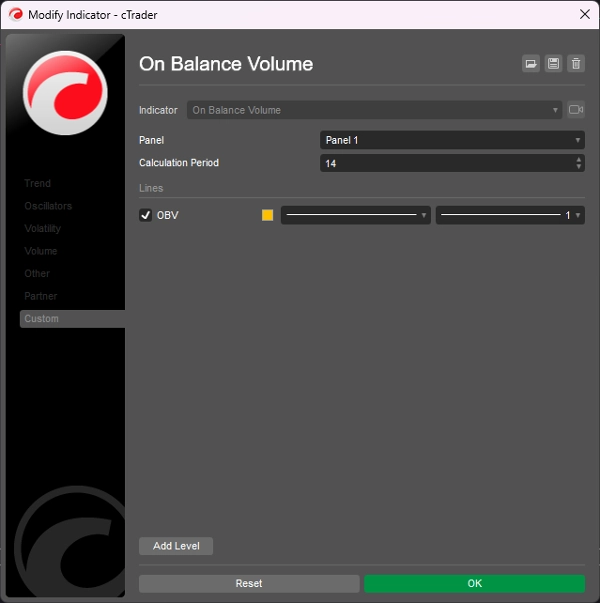
On Balance Volume (OBV) misst den Kauf- und Verkaufsdruck als kumulativen Indikator, der das Volumen an Aufwärtstagen hinzufügt und an Abwärtstagen subtrahiert.
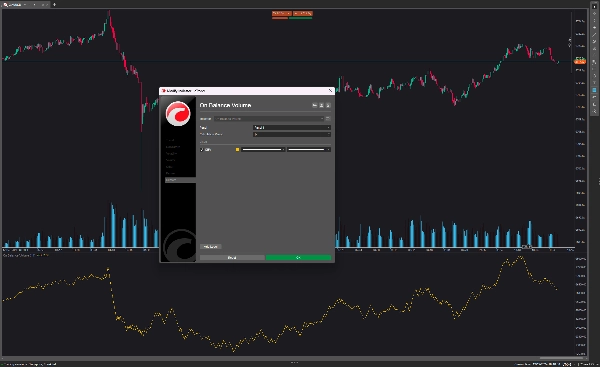
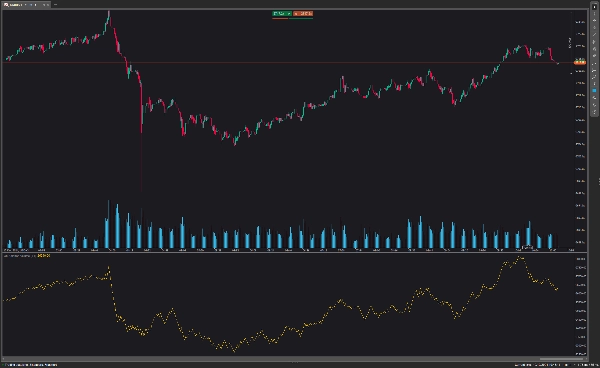
Das On Balance Volume wird unten im Diagramm angezeigt. Die OBV-Linie steigt, wenn der Schlusskurs von heute steigt, und fällt, wenn der Schlusskurs von gestern höher ist als der aktuelle.
Der OBV-Indikator erkennt im Allgemeinen einen Ausbruch vor der Kurslinie und hilft dabei, einen klaren Aufwärtstrend zu etablieren. Wenn Sie mit dieser Strategie handeln möchten, eröffnen Sie eine Forex-Position auf dem Ausbruchspreisniveau und setzen einen Stop-Loss über dem jüngsten Hochpunkt.
Zusammenfassung
KI-Zusammenfassung
On Balance Volume (OBV) is a technical indicator that measures buying and selling pressure by cumulatively adding volume on days when the closing price rises and subtracting volume on days when it falls. Displayed at the bottom of the chart, the OBV line moves upward when today's closing price exceeds the previous day's and moves downward when it is lower. This indicator is used to identify potential breakouts ahead of price movements and to confirm upward trends. Traders using OBV may open positions at breakout price levels and set stop losses above recent high swings. The indicator is applicable in forex markets and supports breakout trading strategies.
Indikatorprofil
Kundenbewertungen
5.0
Bewertungen: 1
5 | 100 % | |
4 | 0 % | |
3 | 0 % | |
2 | 0 % | |
1 | 0 % |
Kundenbewertungen
August 18, 2025
Pros: A lightweight cumulative volume indicator that confirms price moves and detects divergences. Excellent for analyzing trend strength and sentiment. Cons: No alerts, tooltips, or template features. Signals may lag in volatile or manipulated markets.
Diskussion
Häufig gestellte Fragen (FAQ)
Forex
Breakout
Über den cTrader Store verfügbare Produkte, einschließlich Handelsbots, Indikatoren und Plugins, werden von externen Entwicklern bereitgestellt und nur zu Informations- und technischen Zugriffszwecken verfügbar gemacht. cTrader Store ist kein Broker und erbringt keine Anlageberatung, persönlichen Empfehlungen oder eine Garantie für zukünftige Performance.
Mehr von diesem Autor


Preis
2
Verkäufe
6.95K
Kostenlose Installationen