
Chaikin Money Flow
Indikator
130 downloads
Version 1.0, Dec 2024
Windows, Mac
5.0
Bewertungen: 1
Beschreibung
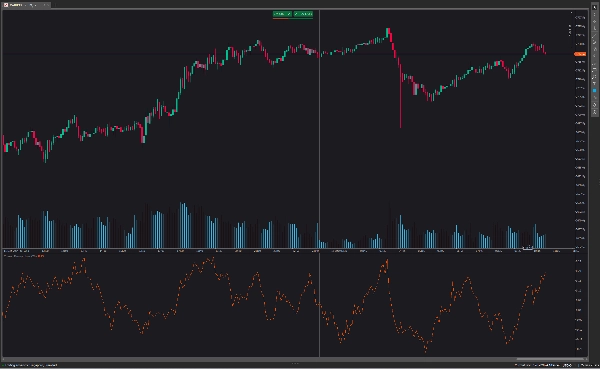
Der Hauptzweck des Chaikin Money Flow ist es, zwischen Phasen der Akkumulation und Distribution eines Wertpapiers zu unterscheiden. Wenn der Indikator über der Nulllinie liegt, zeigt dies an, dass das Wertpapier eine Nettoakkumulation erfährt, was darauf hindeutet, dass Investoren das Asset kaufen.
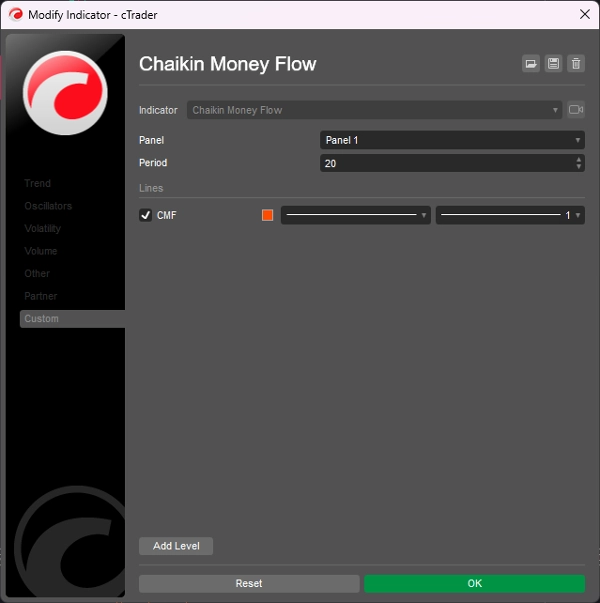
- Chaikin Money Flow-Einstellungen mit Werten über 30 machen den Indikator weniger empfindlich. Dies führt zu weniger, aber qualitativ besseren Signalen.
- Chaikin Money Flow-Einstellungen mit Werten unter 20 machen den Indikator überempfindlich. Dies führt zu mehr Marktrauschen.
- Es zeigt einen anhaltenden Aufwärtstrend an, wenn der CMF-Indikator die Nulllinie von oben kreuzt und Long-/Kaufsignale erzeugt.
- Es zeigt einen anhaltenden Abwärtstrend an, wenn der CMF-Indikator die Nulllinie von unten kreuzt und Short-/Verkaufssignale erzeugt.
Zusammenfassung
KI-Zusammenfassung
The Chaikin Money Flow (CMF) indicator is designed to identify periods of accumulation and distribution for a security. When the CMF value is above zero, it signals net accumulation, indicating buying pressure. Conversely, values below zero suggest distribution or selling pressure. The indicator’s sensitivity can be adjusted: settings above 30 reduce sensitivity, producing fewer but higher-quality signals, while settings below 20 increase sensitivity, resulting in more market noise. Key signals include a continued uptrend when the CMF crosses the zero line from above, generating buy signals, and a continued downtrend when it crosses from below, generating sell signals. This tool helps traders assess buying and selling momentum to inform trading decisions.
Indikatorprofil
Kundenbewertungen
5.0
Bewertungen: 1
5 | 100 % | |
4 | 0 % | |
3 | 0 % | |
2 | 0 % | |
1 | 0 % |
Kundenbewertungen
August 18, 2025
Reliable volume-based trend confirmation, easy to read, customizable period. Cons: No alerts, no MTF analysis, limited filtering options.
Diskussion
Häufig gestellte Fragen (FAQ)
Über den cTrader Store verfügbare Produkte, einschließlich Handelsbots, Indikatoren und Plugins, werden von externen Entwicklern bereitgestellt und nur zu Informations- und technischen Zugriffszwecken verfügbar gemacht. cTrader Store ist kein Broker und erbringt keine Anlageberatung, persönlichen Empfehlungen oder eine Garantie für zukünftige Performance.
Mehr von diesem Autor


Preis
2
Verkäufe
6.9K
Kostenlose Installationen