Descripción
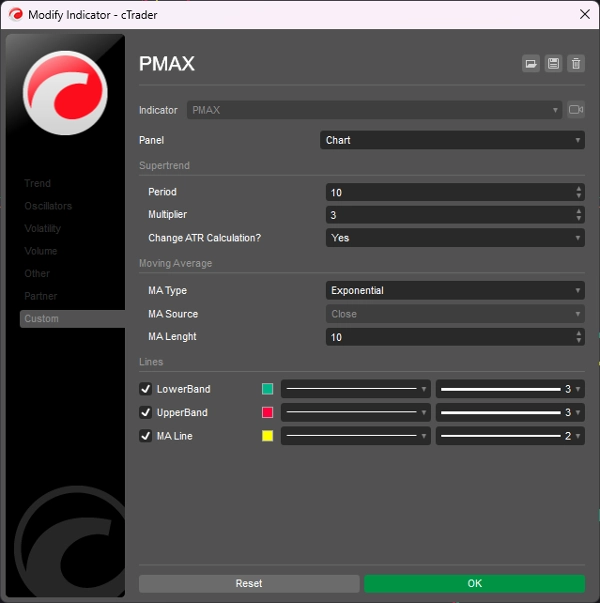
PMax (Maximizador de Ganancias) es un indicador completamente nuevo desarrollado por KivancOzbilgic a principios de 2020.
Es una combinación de dos indicadores de stop loss dinámico;
Uno es el indicador MOST (Moving Stop Loss) de Anıl Özekşi y el otro es el conocido SuperTrend basado en ATR.
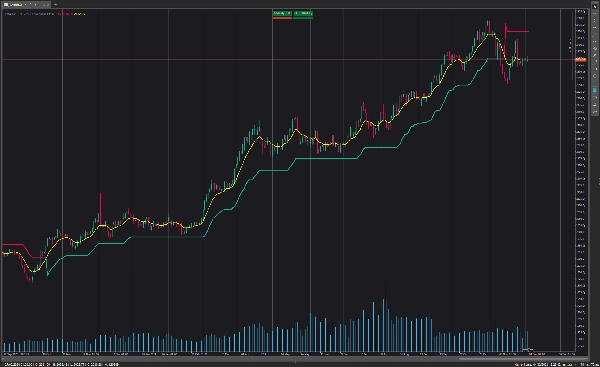
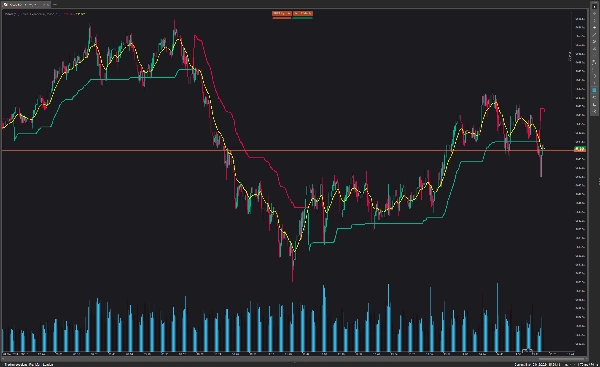
Tanto los indicadores MOST como SuperTrend son muy buenos para sistemas de seguimiento de tendencia, pero por el contrario su rendimiento no es brillante en condiciones de mercado lateral, como la mayoría de los otros indicadores.
Profit Maximizer - PMax intenta resolver este problema. PMax combina los lados poderosos de MOST (Cambiador de Tendencia de Media Móvil) y SuperTrend (detección de precio ATR) en un solo indicador.
Los resultados de backtest y optimización de PMax son mucho mejores en comparación con sus predecesores MOST y SuperTrend. Reduce el número de señales falsas en mercados laterales y ofrece señales de trading más confiables.
PMax facilita la determinación de la tendencia y puede usarse en cualquier tipo de mercados e instrumentos. No repinta.
Resumen
This combination enhances trend identification and reduces false signals during non-trending market phases. Backtesting and optimization show that PMax outperforms its component indicators in reliability and signal accuracy. It is designed for use across various markets and instruments and does not repaint, providing consistent signals for traders.
Valoraciones de clientes
5 | 100 % | |
4 | 0 % | |
3 | 0 % | |
2 | 0 % | |
1 | 0 % |


![Logotipo de "[Hamster-Coder] Moving Average MTF"](https://cdn.ctrader.com/image/webp/b11b98b1-194d-4b8e-b00e-d611826ad159_31226)


![Logotipo de "[Hamster-Coder] Pivot Points MTF"](https://cdn.ctrader.com/image/webp/4c143e5a-309c-40e3-a578-f04d1e133ffa_31159)