Description
Théorie de la boîte Darvas
La théorie de la boîte Darvas est une technique de trading développée par Nicolas Darvas dans les années 1950. C'est une stratégie de trading basée sur le momentum qui utilise l'action des prix pour identifier les points d'entrée et de sortie potentiels sur le marché.
Comment fonctionne la boîte Darvas
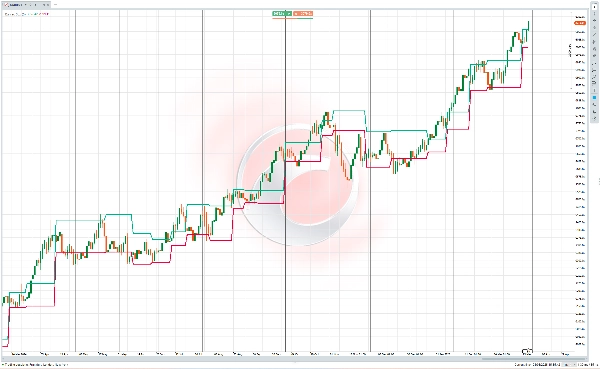
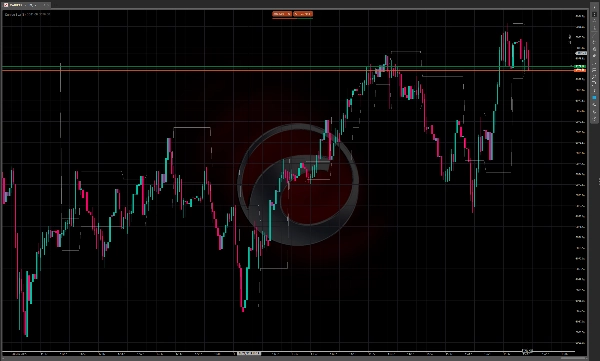
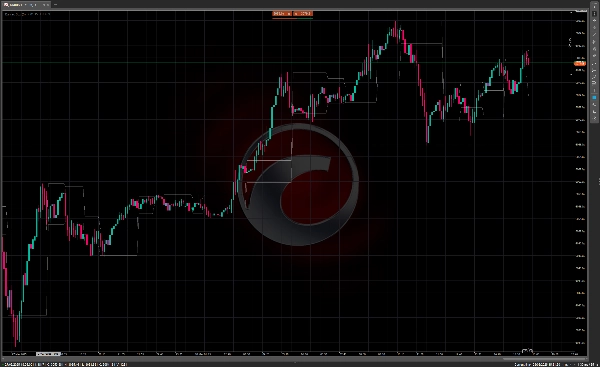
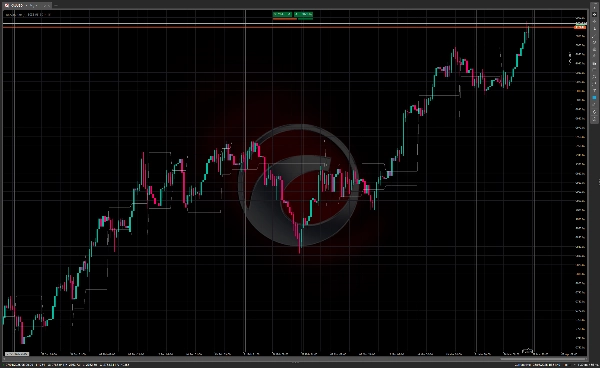
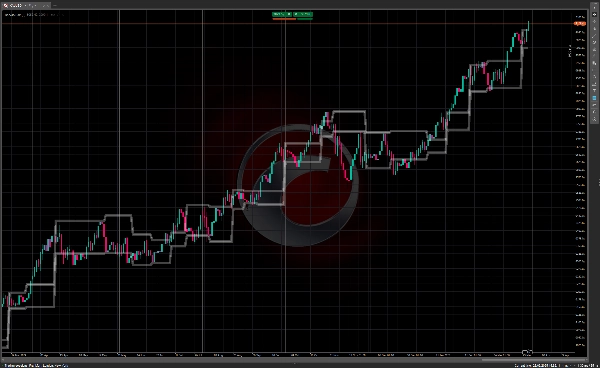
La méthode de la boîte Darvas consiste à identifier des "boîtes" ou des plages de trading où le prix d'une action se consolide avant de casser. Les composants clés incluent :
- Le prix forme une plage de trading définie (la "boîte") avec des limites supérieures et inférieures claires
- La limite supérieure représente une résistance, tandis que la limite inférieure agit comme un support
- Une cassure au-dessus de la boîte signale une opportunité d'achat potentielle
- Une cassure en dessous de la boîte peut être utilisée comme un signal de vente
Les traders utilisant cette technique recherchent généralement des actions montrant une augmentation du volume en même temps que le mouvement des prix, car cela suggère un momentum plus fort derrière la cassure.
Histoire de la théorie de la boîte Darvas
Nicolas Darvas (1920-1977) était une figure assez inhabituelle dans l'histoire du trading. Né en Hongrie, il n'était pas un trader professionnel de formation mais plutôt un danseur qui se produisait dans un duo de danse de salon appelé "Darvas et Julia" avec sa demi-sœur.
Lors de ses tournées mondiales avec sa troupe de danse dans les années 1950, Darvas a commencé à expérimenter le trading d'actions. Ses circonstances étaient uniques — il prenait souvent des décisions d'investissement uniquement sur la base des tableaux boursiers dans les journaux qui lui étaient livrés dans différentes villes lors de sa tournée.
Darvas a développé sa théorie de la boîte par essais et erreurs. Au début, il a perdu de l'argent sur les marchés mais a progressivement affiné son approche. Entre 1956 et 1958, il aurait transformé un investissement de 10 000 $ en plus de 2 millions de dollars en utilisant sa méthode de la boîte — un exploit extraordinaire qui a attiré l'attention.
En 1960, Darvas a publié ses méthodes dans le livre "How I Made $2,000,000 in the Stock Market", qui est devenu un classique de la littérature sur le trading. Le livre détaillait son parcours et expliquait sa théorie de la boîte, apportant cette approche à l'attention du grand public.
Ce qui rendait la méthode de Darvas particulièrement remarquable était sa simplicité et le fait qu'elle ait été développée par un outsider de l'industrie financière. Il se concentrait principalement sur l'action des prix et le volume plutôt que sur l'analyse fondamentale, une approche qui était assez novatrice à l'époque mais qui a depuis influencé de nombreux systèmes de trading technique.
La technique de la boîte Darvas reste populaire parmi les traders techniques aujourd'hui, en particulier ceux qui suivent des stratégies basées sur le momentum dans des marchés en tendance.