الوصف
تحليل حجم احترافي مع حساب دلتا ذكي قائم على الشمعة
افتح قوة تحليل الحجم بمستوى المؤسسات مع ملف حجم دلتا الشمعة المثبت، أكثر مؤشرات ملف الحجم المثبت تقدماً لـ cTrader. مصمم للمتداولين الجادين الذين يطلبون رؤية دقيقة للسوق، يكشف هذا المؤشر عن مكان حدوث النشاط الحقيقي للسوق من خلال حساب دلتا ذكي قائم على الشمعة.
🎯 الميزات الرئيسية
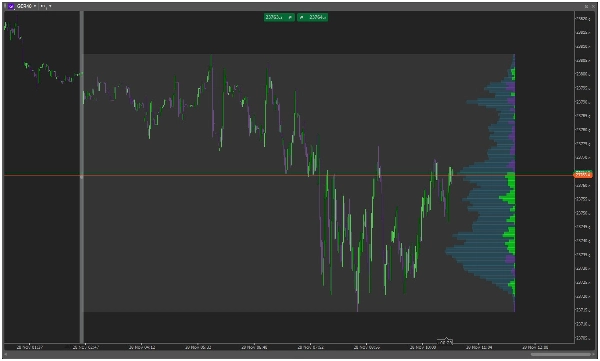
🏓 نظام تثبيت ذكي
- ارسم ببساطة خطًا عموديًا في أي مكان على الرسم البياني الخاص بك
- توليد الملف تلقائيًا مثبتًا على النقطة التي تختارها
- تحديثات ديناميكية مع تطور حركة السعر الجديدة
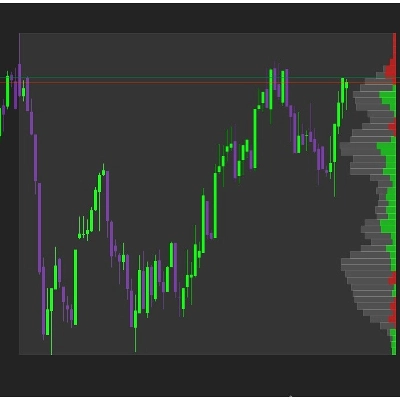
📊 دلتا ذكية قائمة على الشمعة
- تحليل دلتا متقدم يعتمد على اتجاه الشمعة
- الشموع الخضراء = حجم الشراء | الشموع الحمراء = حجم البيع
- تصوير نظيف بلون واحد لكل مستوى سعري
- تحديد فوري لمناطق ضغط الشراء/البيع
🎨 تصميم بصري قابل للتخصيص
- عرض الملف قابل للتعديل (5-100% من النطاق)
- ألوان قابلة للتخصيص لحجم الشراء/البيع/الإجمالي
- ضوابط الشفافية لتكامل مثالي مع الرسم البياني
- تظليل احترافي لتحسين قابلية القراءة
⚡ أوضاع عرض مرنة
- وضع الدلتا: رؤية صافي ضغط الشراء/البيع عند كل مستوى سعري
- وضع الحجم: عرض ملف الحجم التقليدي
- تثبيت على اليمين لاستخدام مثالي لمساحة الرسم البياني
🚀 لماذا يحب المتداولون هذا
"أخيرًا، ملف حجم يعمل ببساطة! حساب دلتا القائم على الشمعة دقيق للغاية لاكتشاف نشاط المؤسسات." - متداول محترف
"مغير قواعد اللعبة لتحليل ملف السوق الخاص بي. نظام التثبيت رائع والنهج القائم على الشمعة منطقي جدًا." - محلل مؤسسي
📈 مثالي لـ
- متداولي ملف السوق - تحديد مناطق القيمة والقمم/القيعان الضعيفة
- منظري سوق المزاد - فهم عمليات تطوير السوق
- استراتيجيات قائمة على الحجم - تأكيد الاختراقات من خلال التحقق من الحجم
- تحليل تدفق المؤسسات - اكتشاف تراكم/توزيع الأموال الذكية
🛠 سهل الاستخدام
- ارسم خطًا عموديًا عند نقطة التثبيت الخاصة بك
- راقب بينما يقوم ملف حجم دلتا الشمعة المثبت بالتوليد التلقائي
- حلل توزيع الدلتا عبر مستويات السعر
- تداول بثقة باستخدام المستويات المؤكدة بالحجم
🔧 المواصفات التقنية
- حساب في الوقت الحقيقي
- استهلاك منخفض للموارد
- متوافق مع جميع الأطر الزمنية
- يعمل مع جميع الأدوات (الفوركس، الأسهم، العملات الرقمية، العقود الآجلة)
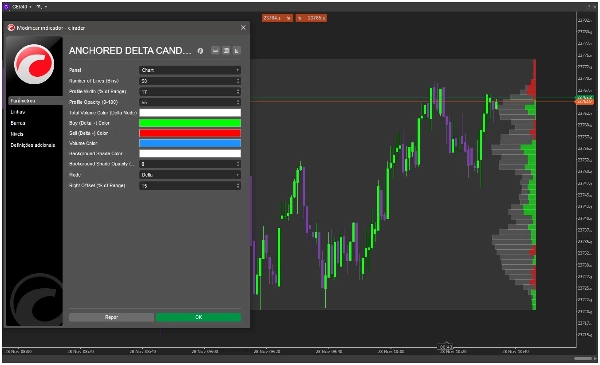
📋 المعلمات المضمنة
- عدد الخطوط/الصناديق (5-100)
- نسبة عرض الملف
- ضوابط الشفافية
- مخططات الألوان المخصصة
- تعديل الإزاحة اليمنى
- وضع العرض (دلتا/حجم)
🎯 حوّل تحليل الرسم البياني الخاص بك اليوم!
انضم إلى آلاف المتداولين المحترفين الذين رفعوا من مستوى تحليلهم للسوق مع ملف حجم دلتا الشمعة المثبت. توقف عن التخمين وابدأ برؤية مكان حدوث النشاط الحقيقي للسوق من خلال حساب دلتا دقيق قائم على الشمعة.
⭐ "الوضوح الذي يجلبه هذا المؤشر لتحليل الحجم لا مثيل له. النهج القائم على دلتا الشمعة عبقري بحت."
أضف ملف حجم دلتا الشمعة المثبت إلى منصة cTrader الخاصة بك اليوم وتداول برؤية على مستوى المؤسسات!


![شعار "Gaussian Channel [Iridio Capital]"](https://cdn.ctrader.com/image/webp/7c039209-5573-4a54-a072-f9528b503103_41960)


