

الوصف
النسخة الجديدة Volume Profile Pro v2 هي مؤشر حجم جانبي ونطاقي قابل للتخصيص بدرجة عالية وخفيف الوزن لمنصة cTrader حيث يمكنك ضبط العديد من الإعدادات حسب تفضيلاتك بما في ذلك نقطة التحكم (POC)، أعلى منطقة قيمة (VAH) وأدنى منطقة قيمة (VAL)
ما الذي يفعله
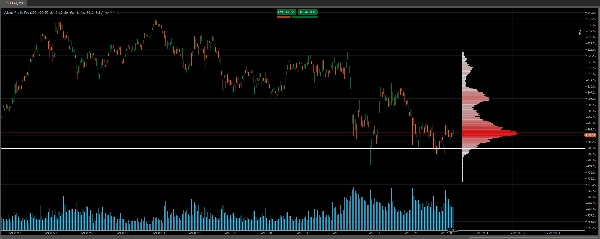
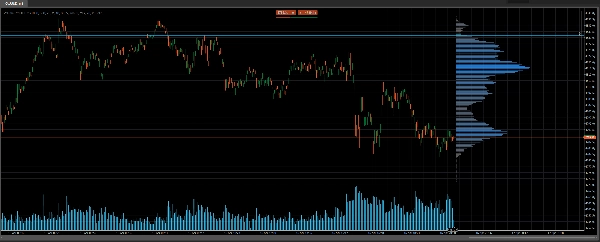
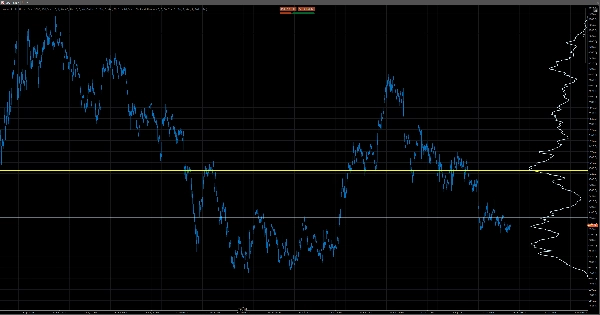
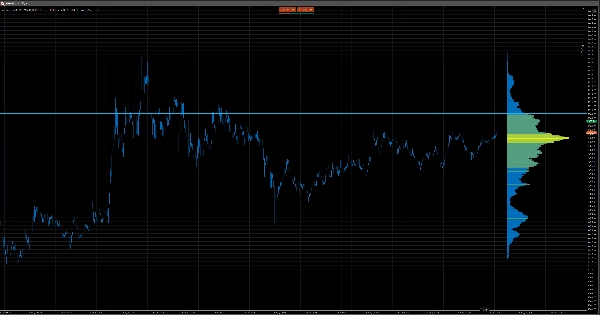
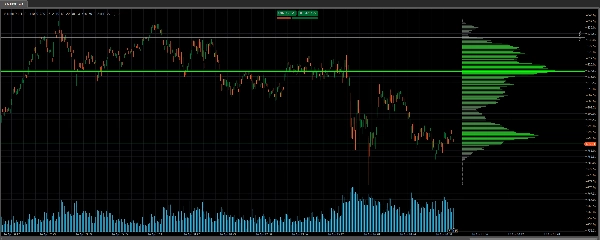
يقوم Volume Profile Pro برسم مخطط شريطي أفقي ديناميكي مباشرة على الجانب الأيمن من مخطط cTrader الخاص بك يظهر كمية الحجم المتداول عند كل مستوى سعري خلال نافذة زمنية قابلة للتكوين. بدلاً من قياس الحجم عبر الزمن، فإنه يقيس الحجم حسب السعر — كاشفًا فورًا عن الأماكن التي تمت فيها معظم الصفقات في السوق. من هذا، يقوم تلقائيًا بحساب ورسم ثلاثة مستويات رئيسية: نقطة التحكم (POC)، السعر الذي يحتوي على أعلى حجم تداول؛ وأعلى منطقة قيمة (VAH) وأدنى منطقة قيمة (VAL)، وهما حدود نطاق السعر الذي يحتوي على 70% من إجمالي حجم التداول (قابل للتكوين).
كيف يعمل
يقوم المؤشر بمسح عدد محدد من الأشرطة التاريخية من قبل المستخدم، ويجد نطاق السعر من الأعلى إلى الأدنى، ويقسمه إلى صفوف سعرية متساوية المسافات. ثم يتم توزيع حجم التيك لكل شريط عبر كل صف سعري يمتد عليه. النتيجة هي مخطط شريطي للحجم عند السعر مع عرض أشرطة قابل للتخصيص يتناسب مع الحجم ونظام ألوان متدرج ينتقل من الصفوف ذات الحجم المنخفض إلى العالي. يعمل بالكامل على بيانات OHLCV على مستوى الشريط القياسي — لا حاجة لتغذية التيك، ولا DOM، ولا مصدر بيانات خارجي — ويعيد الحساب فقط على الشريط الأخير، مما يجعله سريعًا وخفيف الوزن وغير معطل.
قابلية تخصيص عالية
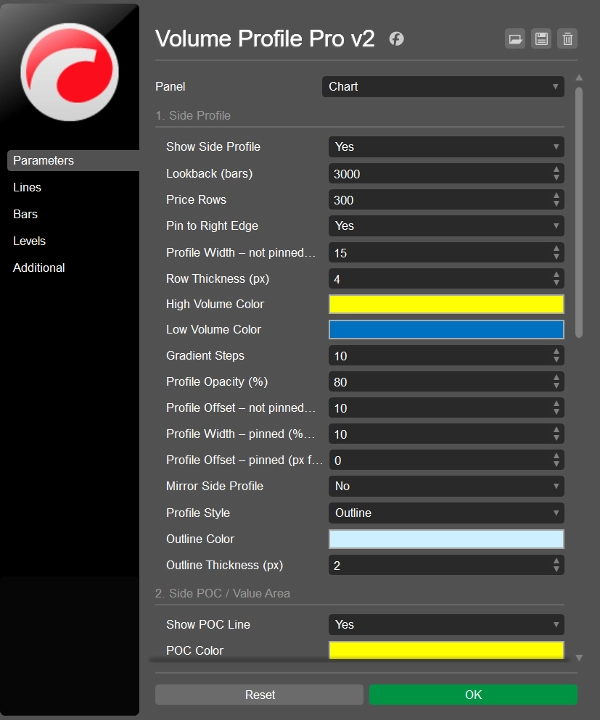
مع Volume Profile Pro v2، يمكن تعديل كل عنصر بصري وتحليلي تقريبًا:
- فترة النظر للخلف للملف الجانبي
- عدد صفوف السعر وسمك الصف
- عرض الملف
- الشفافية
- نظام ألوان متدرج
- يمكنك قلب الملف الجانبي
- يمكنك تثبيت الملف الجانبي على الجانب الأيمن من المخطط
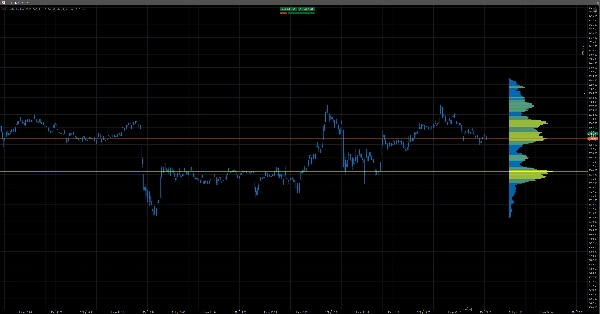
- لديك خيار عرض الملف الجانبي كخط واحد بدلاً من الأشرطة
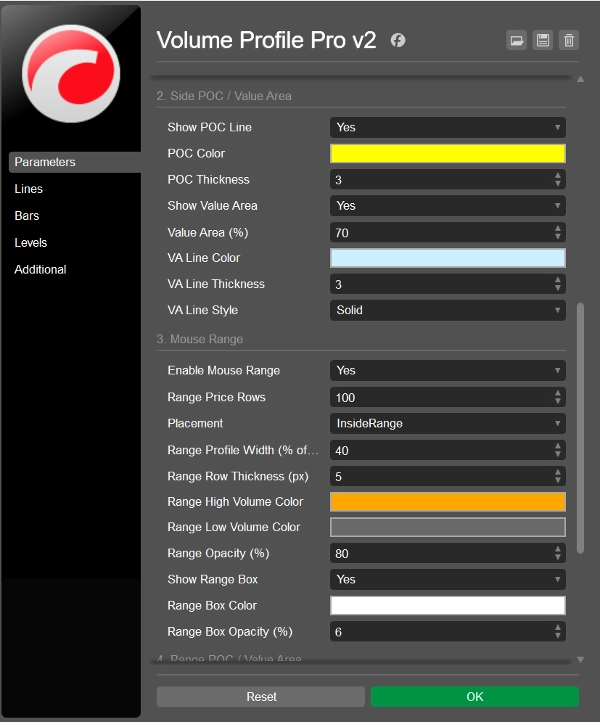
- لون وسمك نقطة التحكم (POC)
- عتبة نسبة منطقة القيمة
- نمط خط منطقة القيمة.
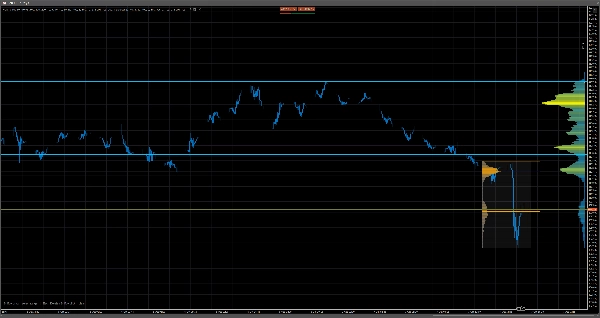
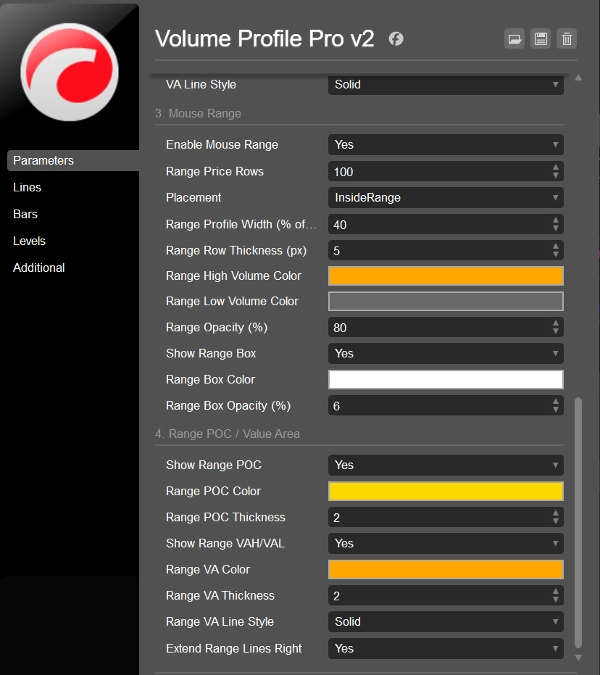
- بالإضافة إلى ذلك، يمكنك الآن عرض ملف نطاق في نطاق محدد. ببساطة اختر مؤشر التقاطع، اسحب مؤشر التقاطع + اضغط على Shift لتحديد النطاق واضغط مرتين على زر Esc لإزالة ملف النطاق.
هذا يجعله قابلاً للاستخدام سواء كطبقة مرجعية خلفية خفية أو كأداة تحليلية مستقلة وجريئة.
لمن هذا مناسب
- المتداولون الذين يريدون مزيجًا من مؤشر حجم جانبي ونطاقي خفيف الوزن
- المتداولون الذين يريدون ملف حجم نظيف المظهر حيث يمكنك حتى عرض ملف الحجم كخط صلب
- المتداولون الذين يريدون تعيين فترة النظر للخلف على المخطط بأنفسهم
- المتداولون الذين يريدون القدرة على تعيين العديد من الألوان والشفافية
- المتداولون الذين يريدون تعديل العرض والموقع على المخطط أو يريدون تثبيته على الجانب
- المتداولون الذين يريدون تعيين عدد صفوف السعر (يوصى بالحفاظ على هذا أقل من 400)
- المتداولون الذين يريدون تشغيل أو إيقاف خطوط نقطة التحكم (POC)، أعلى منطقة قيمة (VAH) وأدنى منطقة قيمة (VAL) وتعديل المظهر
اجمع هذا مع مؤشر Level 2 DOM Volume Delta Pro الخاص بنا لاتخاذ قرارات أكثر اطلاعًا عند المستويات الرئيسية: https://ctrader.com/products/4138
شاهد بوت الصندوق الأسود المذهل لدينا هنا: https://ctrader.com/products/3241
الملخص
The tool analyzes historical bar data by dividing the high-to-low price range into evenly spaced rows and distributing each bar’s tick volume across these rows. This creates a volume-at-price histogram with adjustable bar widths proportional to volume and a gradient color scheme indicating volume intensity. It operates solely on standard OHLCV bar data without requiring tick feeds or external sources, recalculating only on the latest bar to maintain performance.
Users can extensively customize visual and analytical settings, including lookback period, number of price rows, profile width, opacity, colors, and the appearance and visibility of POC, VAH, and VAL lines. This flexibility allows the indicator to serve as either a subtle background reference or a prominent analytical tool. It supports analysis of key market structure concepts such as supply and demand, support and resistance, and liquidity zones.
تقييمات العملاء
5 | 33 % | |
4 | 67 % | |
3 | 0 % | |
2 | 0 % | |
1 | 0 % |







![شعار "[Hamster-Coder] Pivot Points MTF"](https://cdn.ctrader.com/image/webp/4c143e5a-309c-40e3-a578-f04d1e133ffa_31159)











