


Descripción
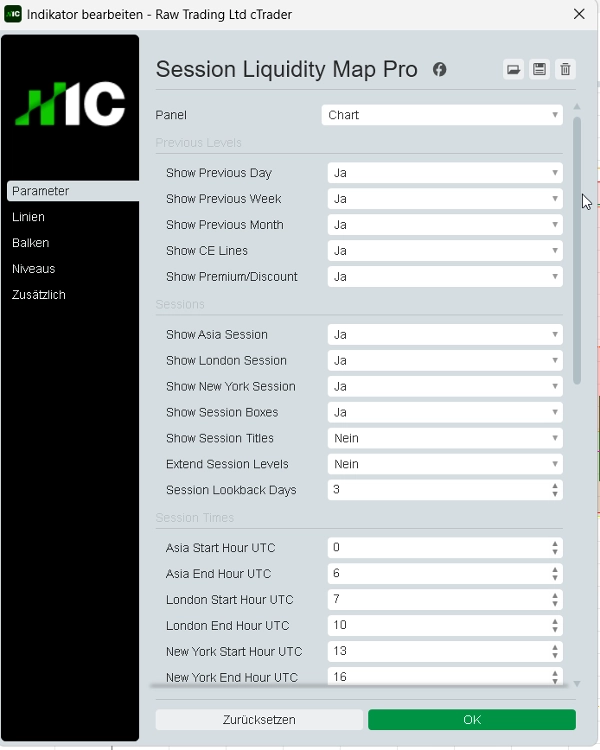
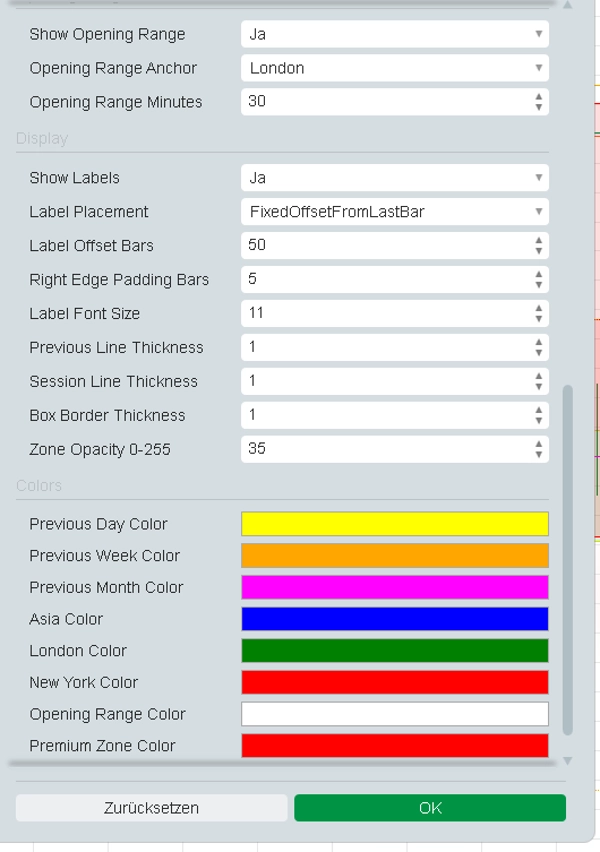
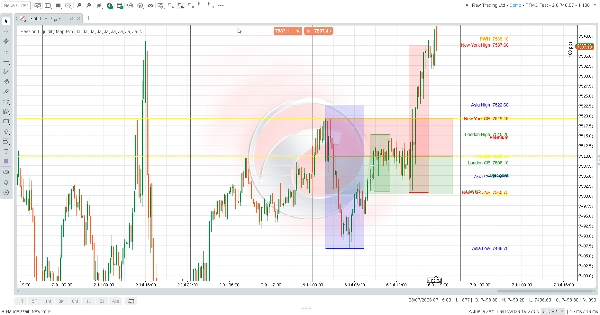
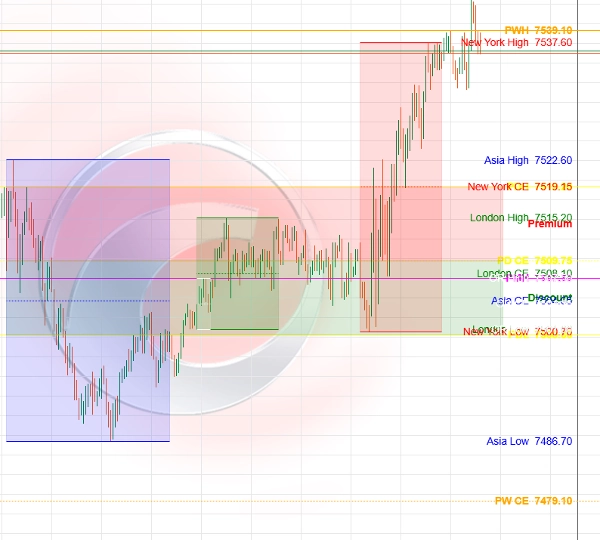
Session Liquidity Map Pro es un indicador visual de cTrader para el análisis estructurado de la acción del precio. Muestra automáticamente los máximos/mínimos del día, semana y mes anteriores con niveles de equilibrio, rangos de sesión de Asia/Londres/Nueva York, niveles de rango de apertura y zonas de prima/descuento.
El indicador está diseñado para la preparación de gráficos, análisis basado en liquidez, revisión de la estructura del mercado e investigación de backtesting. No ejecuta operaciones, no proporciona señales de compra/venta y no requiere Acceso Completo.
El trading implica riesgos. El rendimiento pasado no garantiza resultados futuros.
Resumen
AI summary
Session Liquidity Map Pro is a visual indicator for the cTrader platform designed to enhance structured price action analysis. It automatically maps key market data on your chart, including previous day, week, and month highs and lows, equilibrium levels, and session ranges for Asia, London, and New York. The indicator also highlights opening range levels and premium/discount zones, aiding in liquidity-based analysis and market structure review.
This tool supports chart preparation and backtesting research by visually presenting critical price levels and zones relevant to market participants. It does not execute trades or provide buy/sell signals and operates without requiring full access permissions. The indicator is categorized under market structure and provides visual outputs to assist traders in identifying liquidity sweeps, market structure shifts, key levels, and premium/discount areas.
Session Liquidity Map Pro is suitable for traders focusing on market structure concepts and price action analysis, offering a comprehensive overview of session dynamics and historical price points to inform trading decisions.
This tool supports chart preparation and backtesting research by visually presenting critical price levels and zones relevant to market participants. It does not execute trades or provide buy/sell signals and operates without requiring full access permissions. The indicator is categorized under market structure and provides visual outputs to assist traders in identifying liquidity sweeps, market structure shifts, key levels, and premium/discount areas.
Session Liquidity Map Pro is suitable for traders focusing on market structure concepts and price action analysis, offering a comprehensive overview of session dynamics and historical price points to inform trading decisions.
Perfil del indicador
Categoría del indicador
Estructura del mercado (SMC)
Tipo de resultado
Visualización
Requisitos de datos
Únicamente barras
Señales admitidas
Inversión
Ruptura
Fuerza de la tendencia
Toque de nivel
Ruptura de nivel
Rango en la apertura de la sesión
Valoraciones de clientes
0.0
Valoraciones: 0
Valoraciones de clientes
Este producto todavía no se ha valorado. ¿Ya lo ha probado? Sea el primero en informar a otros.
Conversación
Preguntas frecuentes
Premium/Discount
Supertrend
Key Levels
MSS
Liquidity Sweep
Market Structure
Los productos disponibles a través de cTrader Store, incluidos bots, indicadores y plugins para operar, son proporcionados por desarrolladores de terceros y están disponibles únicamente con fines informativos y de acceso técnico. cTrader Store no es un bróker, por lo que no proporciona asesoramiento de inversión, recomendaciones personales ni ninguna garantía de rentabilidad futura.
Más de este autor


























Precio
4
Ventas