

present
سجل واحصل على خصم 50 دولارًا على مشترياتك الأولى
Trading product for Session Power Model مؤشر Liquidity Sweep Market Structure, image 1
Session Power Model
مؤشر
1 عمليات الشراء
الإصدار 1.0، Jul 2026
Windows, Mac
Trading product for Session Power Model مؤشر Liquidity Sweep Market Structure, image 2
Trading product for Session Power Model مؤشر Liquidity Sweep Market Structure, image 3
Trading product for Session Power Model مؤشر Liquidity Sweep Market Structure, image 4
Trading product for Session Power Model مؤشر Liquidity Sweep Market Structure, image 5
4
المبيعات

الوصف

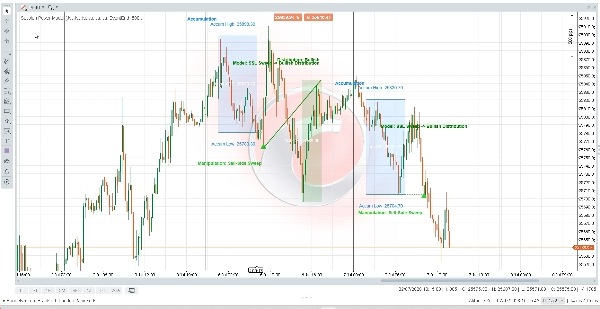
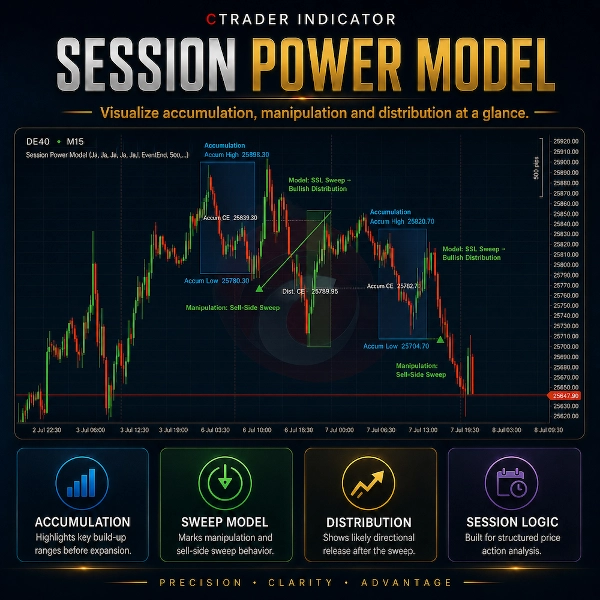
نموذج قوة الجلسة هو مؤشر بصري لـ cTrader مصمم لمساعدة المتداولين على تحليل سلوك الجلسة المتكرر مباشرة على الرسم البياني.


يقسم المؤشر يوم التداول إلى ثلاث مراحل قابلة للتكوين: التراكم، التلاعب والتوزيع. يحدد نطاق التراكم، ويكشف عن عمليات مسح السيولة المحتملة خلال نافذة التلاعب ويصور مرحلة التوزيع التالية.


يمكن للنموذج تحديد عمليات المسح من جانب البيع التي تؤدي إلى سياق توزيع صاعد، وعمليات المسح من جانب الشراء التي تؤدي إلى سياق توزيع هابط، والأيام المختلطة حيث يتم مسح كلا الجانبين.


الميزات الرئيسية:

- تصور نطاق التراكم

- كشف عمليات مسح التلاعب

- عرض مرحلة التوزيع الصاعد والهابط

- خطوط CE للجلسة

- سهام المسح

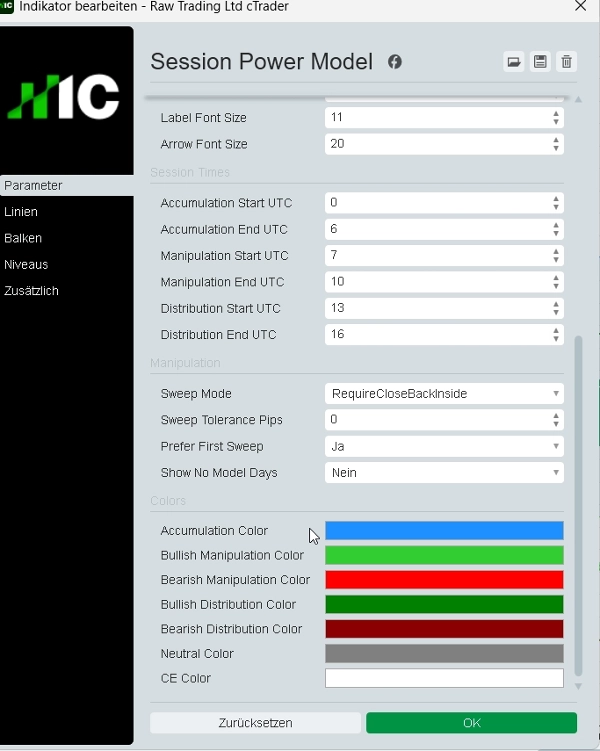
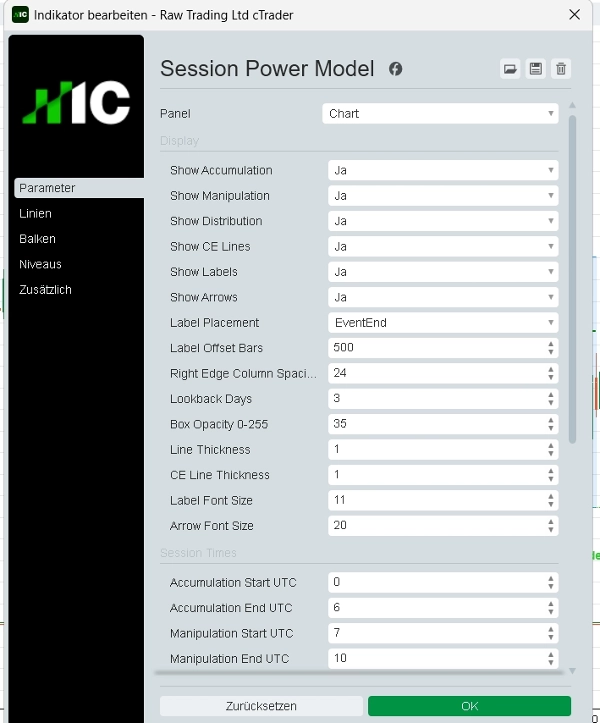
- أوقات الجلسة القابلة للتكوين

- أيام الرجوع القابلة للتعديل

- وضع العلامات على الحافة اليمنى

- تراكب نظيف على الرسم البياني

- ألوان مخصصة، شفافية وإعدادات العلامات

- مؤشر آمن للتخزين مع حقوق وصول مقيدة


تم تصميم نموذج قوة الجلسة لتحليل حركة السعر التقديرية، مراجعة الرسم البياني القائمة على السيولة، أبحاث الجلسة والتحضير للاختبار الخلفي.


هذا المؤشر ليس روبوت تداول. لا ينفذ صفقات، ولا يغير الأوامر أو يوفر إشارات شراء/بيع مضمونة. إنه أداة تصور الرسم البياني وسياق السوق فقط.


التداول ينطوي على مخاطر. هذا المؤشر لا يقدم نصائح مالية، توصيات استثمارية، احتمالات إحصائية أو نتائج تداول مضمونة.

الملخص

ملخص الذكاء الاصطناعي
Session Power Model is a cTrader indicator that visually segments the trading day into three phases: accumulation, manipulation, and distribution. It highlights the accumulation range, detects liquidity sweeps during the manipulation phase, and displays bullish or bearish distribution phases on the chart. The indicator identifies sell-side sweeps leading to bullish distributions, buy-side sweeps leading to bearish distributions, and mixed scenarios involving both sides. Key features include configurable session times, adjustable lookback periods, session CE lines, sweep arrows, customizable colors and labels, and a clean chart overlay. Designed for discretionary price action analysis, liquidity-based chart review, session research, and backtesting preparation, this tool provides market context visualization without executing trades or offering trading signals. It supports analysis focused on market structure, liquidity sweeps, and support/resistance levels.
ملف تعريف المؤشر
فئة المؤشر
هيكل السوق (SMC)
نوع المخرجات
التصور
متطلبات البيانات
أعمدة السعر فقط
الإشارات المدعومة
التباين
الانقطاع
الانعكاس
قوة الاتجاه

تقييمات العملاء

0.0
التقييمات: 0
تقييمات العملاء
لا توجد تقييمات لهذا المنتج حتى الآن. هل جرَّبته بالفعل؟ كن أول من يخبر الآخرين!

مناقشة

الأسئلة الشائعة

Liquidity Sweep
Market Structure
Liquidity Grab
Support & Resistance
يتم توفير المنتجات المتاحة من خلال cTrader Store، بما في ذلك روبوتات التداول والمؤشرات والإضافات، من قبل مطوري الطرف الثالث وإتاحتها لأغراض الوصول المعلوماتي والفني فقط. cTrader Store ليس وسيطًا ولا يقدم نصائح استثمارية أو توصيات شخصية أو أي ضمان للأداء المستقبلي.

المزيد من هذا المؤلف

مؤشر
SMC
Prop
+5
Automatically draws the Opening Range (High & Low) for Tokyo, London, and New York sessions. Configurable start times,
مؤشر
BOS
Key Levels
+2
Maps bullish and bearish order block zones, CE levels and structure-based price action context.
مؤشر
MSS
Key Levels
+4
Maps session ranges, previous highs/lows, equilibrium and premium/discount zones on your cTrader chart.
مؤشر
MSS
Key Levels
+2
Maps equal highs, equal lows and active liquidity pools directly on your cTrader chart.
شعار "Killzone-Indicator"
الأعلى تقييمًا
4.2
(4)
$23
/
$45
مؤشر
SMC
Prop
+12
Killzone, ICT, SMC, Session, Asia, London, New York, NY PM, Session High, Session Low, Smart Money, Order Flow, Trading
مؤشر
BOS
MSS
+3
Maps BOS, CHoCH, swing breaks and market structure shifts directly on your cTrader chart.
مؤشر
EMA
RSI
+2
Compact premium cTrader dashboard for market bias, sessions, premium/discount context, liquidity direction, ADR range an
cBot
ATR
EMA
+4
Professional Supply & Demand Execution Bot for cTrader. CS Apex Hunter Pro is a fully automated execution bot designed
7.6%
العائد على الاستثمار
3.17
عامل الربح

قد يعجبك أيضًا

مؤشر
AI
Forex
+10
Woodie_CCI_pro is an advanced CCI-based toolkit built around the classic Woodie CCI methodology.
شعار "wt.Z-Trend"
الأعلى تقييمًا
4.5
(4)
من $20
مؤشر
Forex
Crypto
+5
This indicator combines two independent analytical engines into a single overlay on your chart.
شعار "cAlgoBuddy - TDI Pro"
الأعلى تقييمًا
4.7
(4)
$129
مؤشر
RSI
Forex
+10
All in One indicator designed to reveal Market Sentiment.
مؤشر
Prop
Forex
+15
Footprint volume indicator showing bid/ask splits at each price level
مؤشر
ATR
SMC
+5
CISD Projections with MTF panel: detects market shifts, auto targets, and clear real-time buy/sell signals.
مؤشر
SMC
Pro Volume Profile with Delta, Session Filters & CSV Export. Precision order flow analysis.
مؤشر
Forex
Crypto
+4
Statistical boundaries that adapt to real-time volatility for a better risk management.
مؤشر
ATR
EMA
+3
High-Tech 3-Level Squeeze Detection with HTF Filter, Carter Entry/Exit Rules, Signal Quality Grading & Real-Time
مؤشر
Prop
VWAP
+15
VWAP with standard deviation bands. Fully customizable colors, periods, and multipliers for precise trading signals
مؤشر
Forex
Renko scalping indicator
مؤشر
ADX
EMA
+4
A multi-timeframe dashboard for cTrader that scores trend direction, momentum, and strength across M15, H1, H4, and D1.
مؤشر
SMC
Breakout
+1
Delta Peak Bubbles is a tick‑chart overlay for cTrader that highlights the strongest momentum spikes.
مؤشر
ATR
Forex
+3
Order Block - Market Structure Signals - This is one of the main indicators in the Market Structure trading system
مؤشر
AI
RSI
+19
The HAI Quantum V10 is an advanced indicator designed for technical analysis.
مؤشر
ADX
ATR
+5
Lorentzian Distance k-NN classifier with kernel regression, BUY/SELL alerts and a collapsible on-chart panel.
مؤشر
ADX
ATR
+5
Adaptive Fibonacci trailing system with regime detection, confidence grading, R:R zones and a live stats dashboard.
مؤشر
VWAP
Volume
+4
Advanced Order Flow & Volume Profiling for cTrader. Unveil institutional footprints, Delta, and Anchored VWAPs.
مؤشر
Key Levels
Market Structure
Buy The Dip is an advanced mean-reversion indicator. It pinpoints extreme seller exhaustion in real-time with TP SL

السعر

4
المبيعات

























