Trading product for DRXFootprint مؤشر Aggressive BOS, image 1
مؤشر
الإصدار 1.0، Jul 2026
Windows, Mac
Trading product for DRXFootprint مؤشر Aggressive BOS, image 2
Trading product for DRXFootprint مؤشر Aggressive BOS, image 3
Trading product for DRXFootprint مؤشر Aggressive BOS, image 4
منذ 08/07/2026

الوصف

DRX OrderFlux turns the tick stream into an order flow chart: who is paying up,

where they are being stopped, and which levels the auction keeps coming back to.


WHAT IT DRAWS


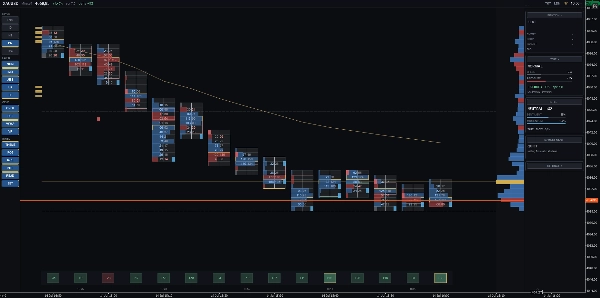
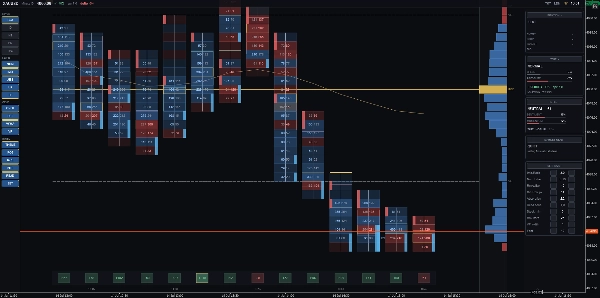
Bid x ask footprint. Every bar is split into price levels with buy and sell

activity side by side, so a bar is no longer one candle but the argument that

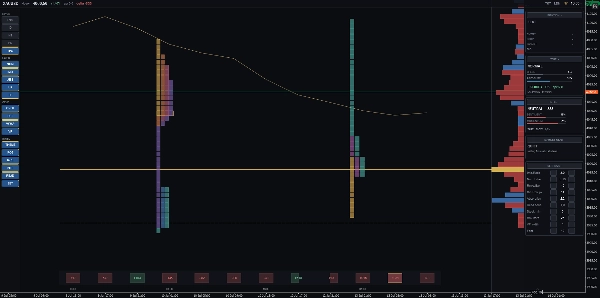
built it. Five views: Bid x Ask, Delta, Heatmap, Profile and TPO.


Imbalances and stacked walls. A level where one side is beaten by the ratio you

set is marked, and a run of them is labelled - stacked imbalances are where the

next move usually starts.


Absorption and unfinished auctions. Heavy activity that fails to move price, and

extremes that closed without being finished, are marked as they form.


Single prints. Levels the market touched once and left behind.


Volume profile in its own framed panel, pinned to the right edge with POC, VAH

and VAL, plus session VWAP.


TPO time blocks, one profile per session with its own POC, coloured warm to cool

across the day - so yesterday's shape stands beside today's and you can see

whether the auction has moved.


Delta lane along the foot of the chart, on one line so the bars can actually be

compared, with the loud ones outlined.


Market read. Deliberately quiet. It speaks only when price rejects a level it

cannot get through, or breaks one with volume, delta and range behind it. Every

threshold is a multiple of the instrument's own recent average, so gold and a

forex pair calibrate themselves - there is nothing to tune per symbol.


Tape panel. Speed of the tape against its own normal, buying against selling

pressure, and a liquidity warning when the book thins out and the spread widens.


Position panel. Entry, stop, target, PnL, pips and R:R - and the chart itself

gets three thin lines and nothing more. No candle is ever covered.


Your layout is remembered per symbol and timeframe, so the desk you build is the

desk you come back to.


HOW TO USE IT


Works on any symbol and any timeframe. It is at its best on the intraday charts

where order flow lives: M1 to H1 on gold, indices, oil and the major forex pairs.

Add DRX Footprint Lower underneath for volume, delta, cumulative delta or buy vs

sell flow in its own pane.


ABOUT THE DATA - PLEASE READ


cTrader tick data carries time, bid and ask. It does not carry trade size, and no

indicator on this platform can invent it. DRX OrderFlux therefore measures tick

activity, not traded contracts - the same basis MetaTrader order flow tools use on

forex and CFDs. It reads the balance of aggression honestly and it is genuinely

useful, but if you need exchange-traded contract volume, this is not that, and I

would rather tell you now than take your money.


Depth of market is a broker feed. Most cTrader CFD accounts publish only a few

aggregated levels, so no order book ladder is included - what the book does tell

us, a liquidity warning, is in the tape panel instead.


Trading involves risk. Past performance does not guarantee future results.

الملخص

ملف تعريف المؤشر

تقييمات العملاء

0.0
التقييمات: 0
تقييمات العملاء
لا توجد تقييمات لهذا المنتج حتى الآن. هل جرَّبته بالفعل؟ كن أول من يخبر الآخرين!

مناقشة

الأسئلة الشائعة

Aggressive
BOS
Imbalance
Order Block
Volume
CHOCH
DOM Tools
يتم توفير المنتجات المتاحة من خلال cTrader Store، بما في ذلك روبوتات التداول والمؤشرات والإضافات، من قبل مطوري الطرف الثالث وإتاحتها لأغراض الوصول المعلوماتي والفني فقط. cTrader Store ليس وسيطًا ولا يقدم نصائح استثمارية أو توصيات شخصية أو أي ضمان للأداء المستقبلي.

قد يعجبك أيضًا

مؤشر
ATR
SMC
+5
CISD Projections with MTF panel: detects market shifts, auto targets, and clear real-time buy/sell signals.
مؤشر
Prop
Forex
+13
"Footprint Chart: Visualize bid-ask volume inside candles for clearer order flow and market depth insights."
مؤشر
EMA
SMA
+2
Smart volume analysis with BP detection, trend confirmation and breakout signals for professional traders.
شعار "SMC-ICT Control Panel"
الأعلى تقييمًا
4.2
(4)
من 19$/أسبوع
مؤشر
SMC
BTCUSD
+5
SMC ICT Control Panel The all-in-one Smart Money command center for cTrader. One indicator. Every SMC/ICT tool. Zero clu
مؤشر
SMA
Volume
+3
Every timeframe. One glance. See exactly where price sits, and where it's heading.
مؤشر
Forex
Crypto
+5
This indicator combines two independent analytical engines into a single overlay on your chart.
مؤشر
ATR
Signal
One of the best indicators we have ever developed, with a very high profit ratio.
مؤشر
SMC
Breakout
+1
Delta Peak Bubbles is a tick‑chart overlay for cTrader that highlights the strongest momentum spikes.
مؤشر
AI
ATR
+27
The Professional “All-in-One” Trading Suite (buy and sell indicator)
مؤشر
AI
ATR
+27
VWAP Sniper Elite -- Institutional Trend Engine
مؤشر
Smart Signal Reversal Trend + Patterns
مؤشر
ATR
RSI
+2
This indicator works best as a trend-confirmation tool—wait for multiple signals!
مؤشر
RSI
Forex
+7
Advanced S/R + liquidity zone detector with auto-configured trade styles. Generates filtered entry signals with TP/SL.
مؤشر
Volume
Key Levels
Money Flow Profile maps traded volume and market sentiment across price levels, revealing key liquidity zones and trends
مؤشر
Forex
Crypto
+3
This is a tool to help traders open orders/close orders/modify orders quickly with just one click
مؤشر
AI-assisted
Predictive Monte Carlo Engine Forecast future price paths using institutional-grade statistical models and probability
مؤشر
Ultra-Flexible VWAP Indicator with Advanced Customization
مؤشر
EMA
MACD
+2
Combines MACD's Fast/Slow EMAs with a dynamic Volume Profile, coloring volume by direction and highlighting the POC.

السعر

منذ 08/07/2026