

Description
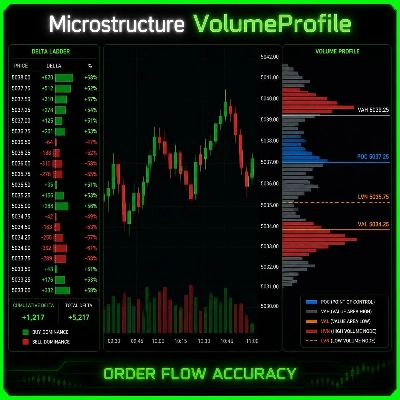
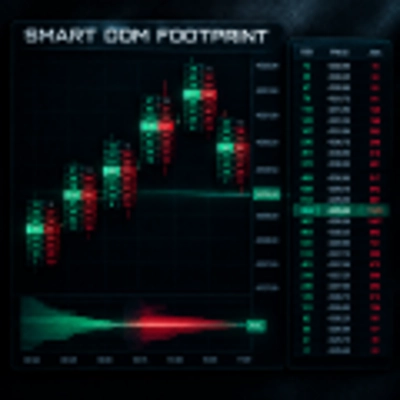
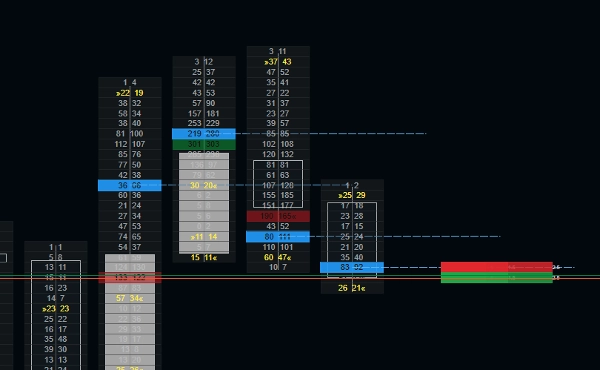
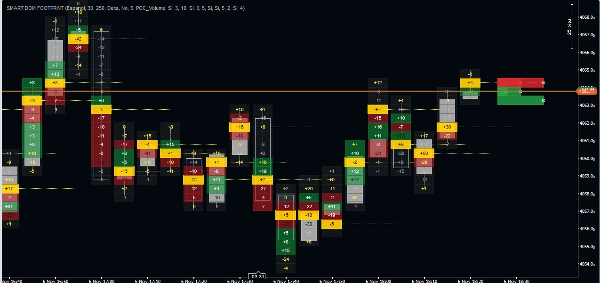
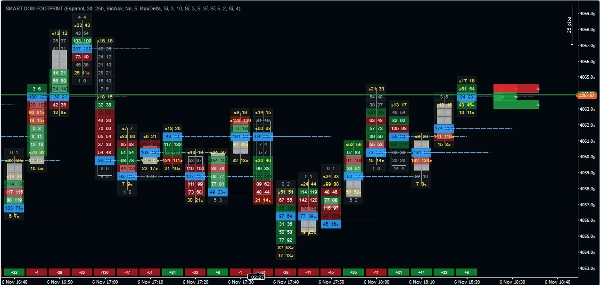
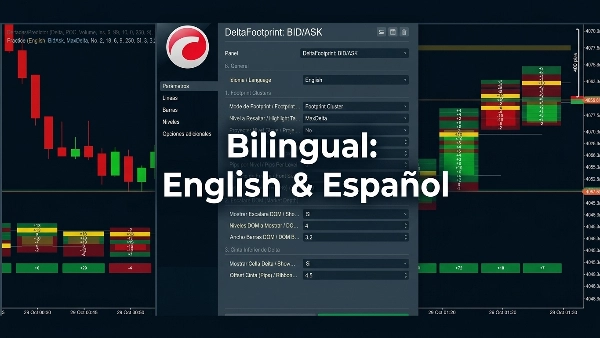
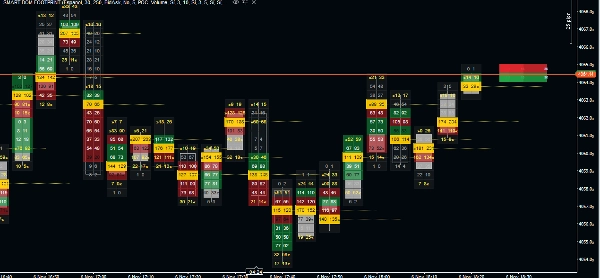
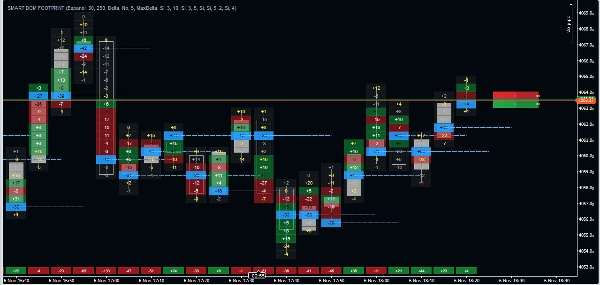
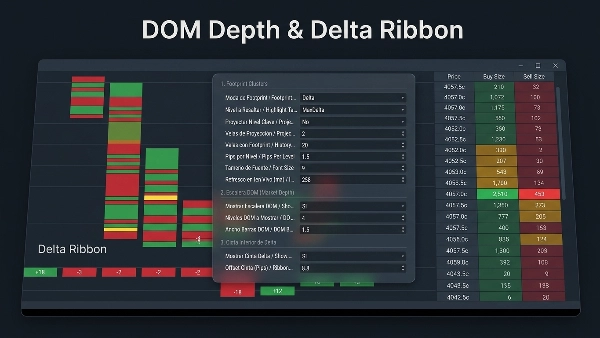
SMART DOM FOOTPRINT is an order flow analysis tool for cTrader that combines Depth of Market (DOM), Footprint Clusters, Delta analysis, and Point of Control (POC) visualization in a single interface.
🔹 Main Features
Smart DOM (Depth of Market)
Displays available market depth through a price ladder, helping traders monitor Bid and Ask liquidity levels provided by their broker's data feed.
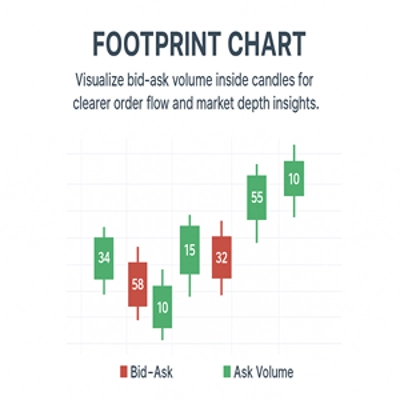
Footprint Clusters
Displays volume information at each price level within a candle, allowing traders to analyze buying and selling activity in greater detail.
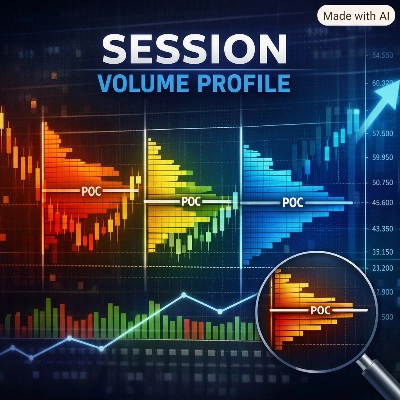
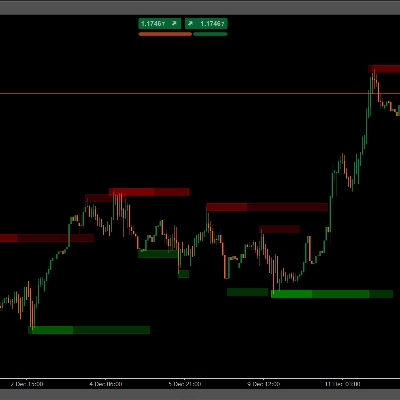
Point of Control (POC) & Volume Nodes
Identifies high-volume areas and highlights key levels that may be relevant for market analysis.
Integrated Delta Module
Shows the difference between buying and selling pressure on each candle, helping traders evaluate market participation and price-volume relationships.
💻 Compatibility
Platforms:
• cTrader for Windows
• cTrader for Mac
Market Data:
Volume, depth of market, and order flow information depend on the broker's available data feed.
For Forex and CFD markets, volume information is typically based on tick volume rather than centralized exchange-traded volume. Availability of DOM and Level II data may vary depending on the broker.
Recommended Hardware:
• Intel Core i5 / AMD Ryzen 5 or equivalent
• 8 GB RAM or higher
📊 Technical Specifications
Platform:
• cTrader
Markets:
• Forex
• CFDs
• Futures
• Cryptocurrencies
• Indices
Visual Components:
• Smart DOM ladder
• Footprint clusters
• Delta analysis
• Point of Control (POC)
• Key volume levels
Visualization & Scaling
The display and aggregation of market data depend on the selected symbol, its tick size, price increment structure, and the scale configuration chosen by the user.
Footprint clusters, volume distribution, DOM levels, and Delta visualization may appear differently across markets such as Forex, Indices, Futures, Cryptocurrencies, and CFDs due to differences in price precision and market data