
Daily SD Levels - Indicator
مؤشر
4 عمليات الشراء
الإصدار 1.0، Aug 2025
Windows, Mac
5.0
التقييمات: 1
الوصف
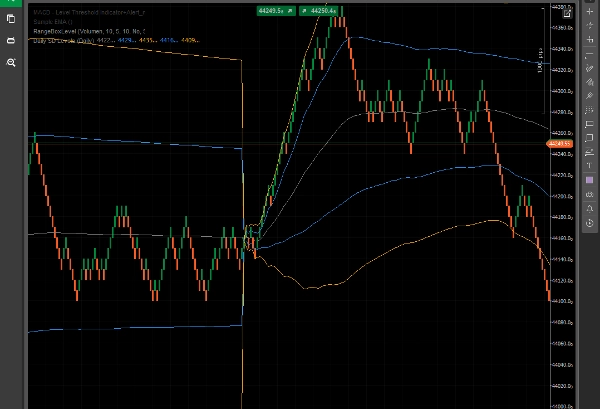
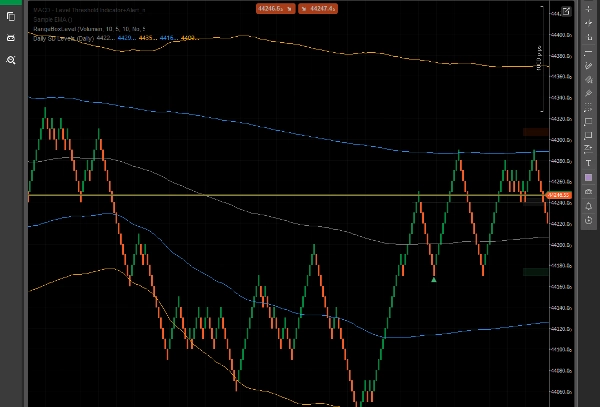
مستويات الانحراف المعياري اليومية – أشرطة الانحراف المعياري الديناميكية القائمة على VWAP
مؤشر مستويات الانحراف المعياري اليومية يرسم VWAP (متوسط السعر المرجح بالحجم) الديناميكي و أشرطة الانحراف المعياري (+1/+2 و -1/-2) المحسوبة على مدار يوم التداول الحالي.
تساعد هذه الأداة المتداولين على تقييم التقلبات داخل اليوم بصريًا، ومناطق الدعم/المقاومة المحتملة، والحدود السعرية القصوى، وكل ذلك بناءً على حجم السوق الفعلي وحركة السعر – وليس مستويات ثابتة أو تعسفية.
الميزات الرئيسية:
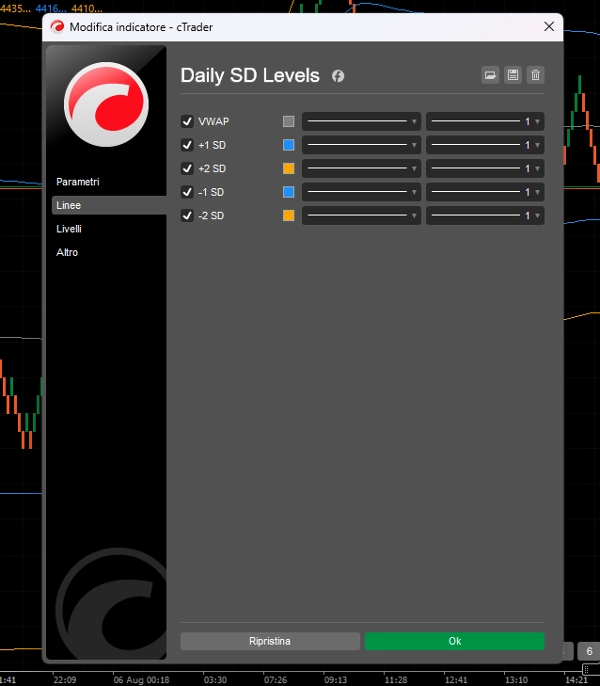
- خط VWAP لتتبع القيمة العادلة داخل اليوم.
- أشرطة الانحراف المعياري +1/+2 و -1/-2 لتحديد مناطق الشراء المفرط/البيع المفرط.
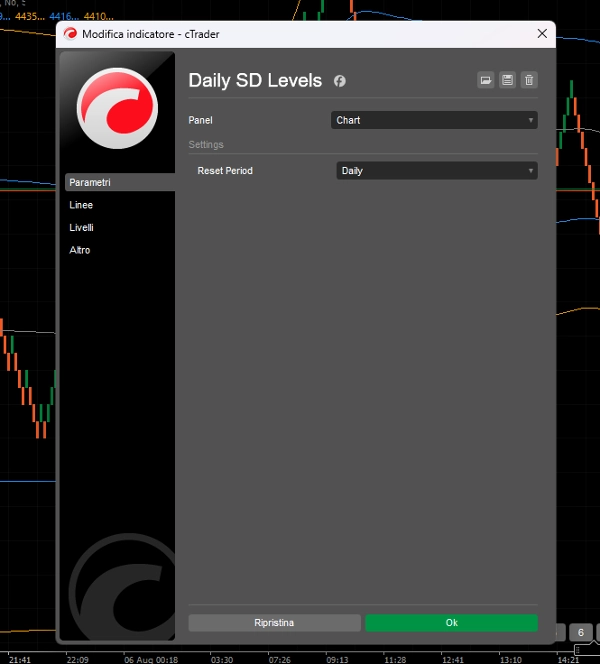
- المستويات تُعاد ضبطها يوميًا، متكيفة مع ديناميكيات السعر والحجم لكل جلسة.
- محسّن لـ رينكو، بار النطاق، والتداول داخل اليوم.
- مصمم للمتداولين الذين يحتاجون إلى وضوح ومناطق سعرية ديناميكية.
هذا المؤشر مثالي لـ:
- إعدادات الانعكاس المتوسط.
- تحديد التحركات الممتدة للانعكاسات المحتملة.
- تأكيد بصري للاختراقات خارج الحدود الإحصائية.
لا فوضى. فقط مستويات نظيفة ومتجاوبة تتحرك مع السوق.
الملخص
ملف تعريف المؤشر
تقييمات العملاء
5.0
التقييمات: 1
5 | 100 % | |
4 | 0 % | |
3 | 0 % | |
2 | 0 % | |
1 | 0 % |
تقييمات العملاء
August 8, 2025
it gives context without making the decision, but the chart still needs a human read.
مناقشة
الأسئلة الشائعة
يتم توفير المنتجات المتاحة من خلال cTrader Store، بما في ذلك روبوتات التداول والمؤشرات والإضافات، من قبل مطوري الطرف الثالث وإتاحتها لأغراض الوصول المعلوماتي والفني فقط. cTrader Store ليس وسيطًا ولا يقدم نصائح استثمارية أو توصيات شخصية أو أي ضمان للأداء المستقبلي.


السعر
منذ 16/07/2025
5
المبيعات