
On Balance Volume
مؤشر
249 التنزيلات
الإصدار 1.0، Dec 2024
Windows, Mac
5.0
التقييمات: 1
الوصف
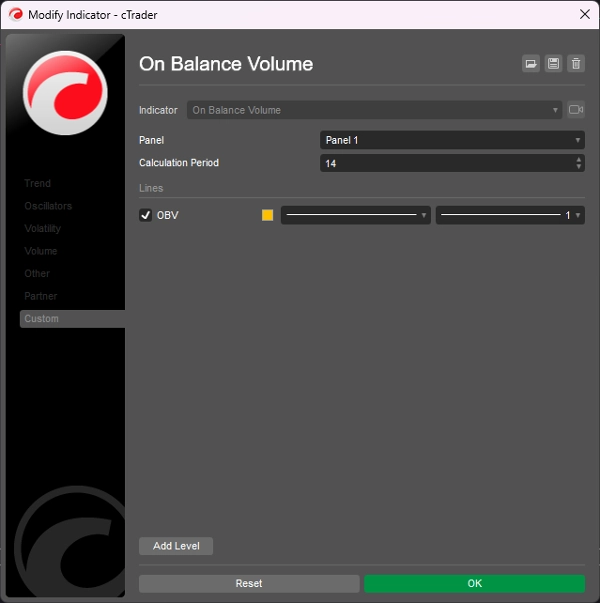
يقيس حجم الرصيد (OBV) ضغط الشراء والبيع كمؤشر تراكمي يضيف الحجم في الأيام الصاعدة ويطرح الحجم في الأيام الهابطة.
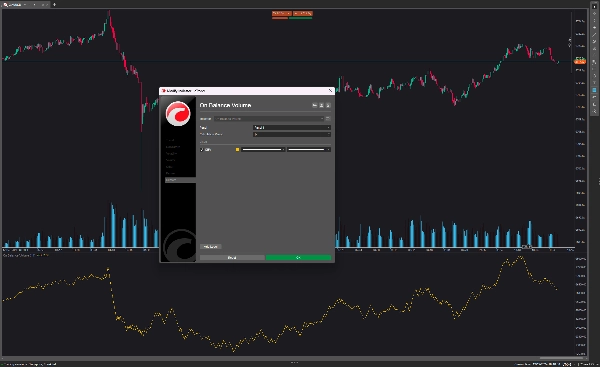
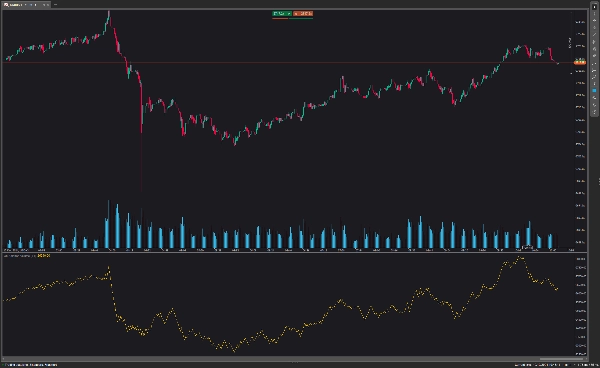
يتم عرض حجم الرصيد في أسفل الرسم البياني. يرتفع خط OBV عندما يرتفع سعر الإغلاق اليومي وينخفض عندما يكون سعر إغلاق الأمس أعلى من السعر الحالي.
عادةً ما يحدد مؤشر OBV الاختراق قبل خط السعر ويساعد في تحديد اتجاه صعودي واضح. إذا كنت ترغب في التداول بهذه الاستراتيجية، تفتح مركز فوركس عند مستوى سعر الاختراق وتضع وقف خسارة فوق أعلى تأرجح حديث
الملخص
ملخص الذكاء الاصطناعي
On Balance Volume (OBV) is a technical indicator that measures buying and selling pressure by cumulatively adding volume on days when the closing price rises and subtracting volume on days when it falls. Displayed at the bottom of the chart, the OBV line moves upward when today's closing price exceeds the previous day's and moves downward when it is lower. This indicator is used to identify potential breakouts ahead of price movements and to confirm upward trends. Traders using OBV may open positions at breakout price levels and set stop losses above recent high swings. The indicator is applicable in forex markets and supports breakout trading strategies.
ملف تعريف المؤشر
تقييمات العملاء
5.0
التقييمات: 1
5 | 100 % | |
4 | 0 % | |
3 | 0 % | |
2 | 0 % | |
1 | 0 % |
تقييمات العملاء
August 18, 2025
Pros: A lightweight cumulative volume indicator that confirms price moves and detects divergences. Excellent for analyzing trend strength and sentiment. Cons: No alerts, tooltips, or template features. Signals may lag in volatile or manipulated markets.
مناقشة
الأسئلة الشائعة
Forex
Breakout
يتم توفير المنتجات المتاحة من خلال cTrader Store، بما في ذلك روبوتات التداول والمؤشرات والإضافات، من قبل مطوري الطرف الثالث وإتاحتها لأغراض الوصول المعلوماتي والفني فقط. cTrader Store ليس وسيطًا ولا يقدم نصائح استثمارية أو توصيات شخصية أو أي ضمان للأداء المستقبلي.


السعر
2
المبيعات
6.92K
التثبيتات المجانية