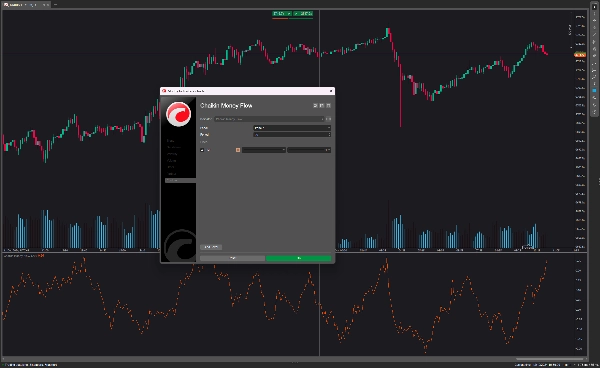
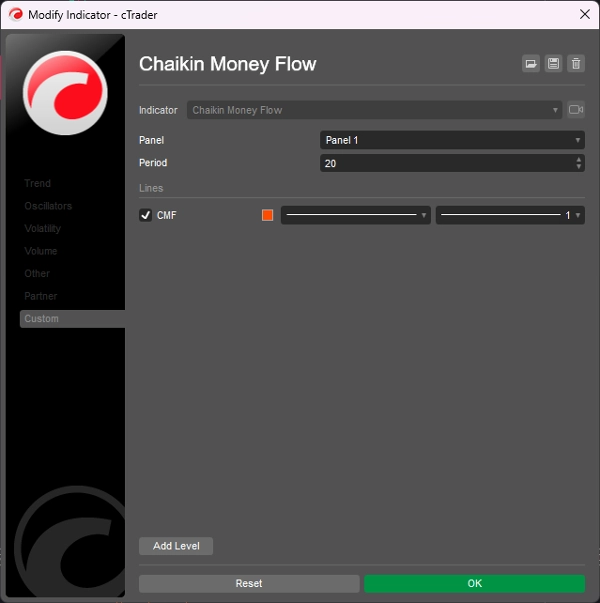
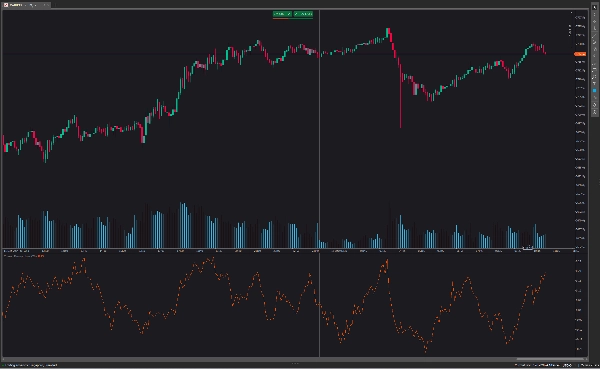
Chaikin Money Flow
"Chaikin Money Flow" โลโก้
5.0
03/09/2025
98
Desktop
ตั้งแต่ 03/10/2024
การขาย
1
ติดตั้งฟรี
5300
"Chaikin Money Flow" ภาพที่อัปโหลด"Chaikin Money Flow" ภาพที่อัปโหลด"Chaikin Money Flow" ภาพที่อัปโหลด

Chaikin money flow's primary purpose is to distinguish between periods of accumulation and distribution of a security. When the indicator is above the zero line, it indicates the security is experiencing net accumulation, suggesting that investors are buying the asset.

  • Chaikin Money Flow settings with values over 30 make the indicator less sensitive. This will result in fewer, but better quality signals.
  • Chaikin Money Flow settings with values below 20 make the indicator over-sensitive. This will result in more market noise.
  • It indicates a continued uptrend when the CMF indicator crosses the zero line from above and generates long/buy signals.
  • It indicates a continued downtrend when the CMF indicator crosses the zero line from below and generates short/sell signals.
5.0
รีวิว: 1
5
100 %
4
0 %
3
0 %
2
0 %
1
0 %
รีวิวจากลูกค้า
August 18, 2025
Reliable volume-based trend confirmation, easy to read, customizable period. Cons: No alerts, no MTF analysis, limited filtering options.
เพิ่มเติมจากผู้เขียนคนนี้
เรตติ้งสูง
ฟรี
PMAX
It's a combination of two trailing stop loss and the other one is well-known ATR-based SuperTrend.
cBot
VWAP
RSI
Breakout
+5
Investion X V1.9 - Intelligent Filter-Based Trading System
Trading system combining martingale strategy with multi-layered technical analysis and comprehensive protection features
MultiTimeFrame Moving Averages
3 moving averages with different periods and different time frames.
เรตติ้งสูง
ฟรี
Machine Learning Momentum Index
The Machine Learning Momentum Index (MLMI) represents the next step in oscillator trading.
StochasticRSI
Stochastic RSI (StochRSI) is a technical indicator used to measure the strength and weakness of the RSI.
Laguerre RSI
Laguerre RSI is based on John EHLERS' Laguerre Filter to avoid the noise of RSI.
On Balance Volume
On Balance Volume (OBV) measures buying and selling pressure as a cumulative indicator.
KDJ
The KDJ oscillator display consists of 3 lines (K, D and J - hence the name of the display) and 2 levels.
Quantitative Qualitative Estimation
The QQE (Quantitative Qualitative Estimation) Weighted Oscillator improves its original version by weighting the RSI.
Darvas Box
The Darvas Box involves identifying "boxes" or trading ranges where a stock's price consolidates before breaking out.
Ichimoku Cloud Indicator
The Ichimoku Cloud is a comprehensive technical analysis system developed by Japanese journalist Goichi Hosoda
cBot
Grid
Martingale
Investion Basic
This is a basic martingale bot without an indicator. For long and short trading options at the same bot.
นอกจากนี้คุณยังอาจชอบ
Trend Pulse X
is a trend-following indicator designed to provide a clear view of market direction, momentum, and strength
ยอดนิยม
$ 15
MA Sabres
Conquer the markets with MA Sabres! This indicator spots trend flips with MAs and cool Sabre shapes & alerts.
Nebula Range Filter Pro
⚡Nebula Range Filter is a professional trend filter indicator for cTrader⚡
ACTO-v1
ACTO: Oscillator tracking average candle duration to anticipate volatility shifts in trading.
Hull Moving Average Colored
The traditional Hull Moving Average with different colours based on the slope (direction) of the trend.
PREMIUM SSL CHANNEL
SSL Channel: Tracks trends 📈 measures volatility ⚡filters noise via ATR+SSL. Clear signals for precise entries/exit...
VegaXLR - Auto Support and Resistance
cTrader Auto Support & Resistance detects key levels with Fibonacci analysis and sends real-time trading alerts.
MeetAlgo_ChannelTrading_cTrader
Channel Trading is a volatility-based indicator using envelope theory to spot price breakouts and trade signals.
SuperTrend from TradingView
Get the exact SuperTrend experience from TV, now perfectly rebuilt for cTrader
E7 Indicators Free Overlays
Bollinger Band Cloud, Heiken Ashi, Trend Follower and Parabolic SAR.
[Stellar Strategies] QQE
The QQE indicator is a technical analysis tool designed to identify potential trend changes and trading signals 📈📉
SmartArrows AI V2
High-Performance Renko Chart Indicator with Advanced AI Filtering.
SessionOne
Session One is a tool for marking from to, useful if you've set the hours you want to trade
MACD Histogram PRO
Enhance MACD Histogram! Visualize bull and bear price changes with vibrant colors for clearer, more insightful trading.
FVG_Bruno
Fair Value Gap
[Hamster-Coder] Pivot Points (Demo)
[Hamster-Coder] Pivot Points (Demo)